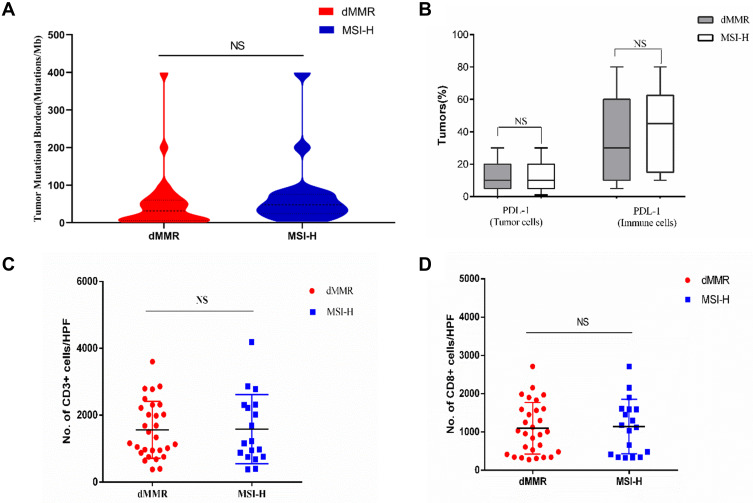
Figure 7.
Neoantigen load and PD-L1 expression level in dMMR and MSI-H endometrial tumors. (A) TMB per megabase in tumor DNA exons and introns detected by ColoSeq. Red and blue represent dMMR and pMMR tumors, respectively. (B) Average numbers of PD-L1–expressing tumor cells and TILs (B), CD3+ immune cells (C), and CD8+ immune cells (D) identified by IHC. NS, nonsignificant at p>0.05 (Mann–Whitney U-test).
Abbreviation: HPF, high-power field.

