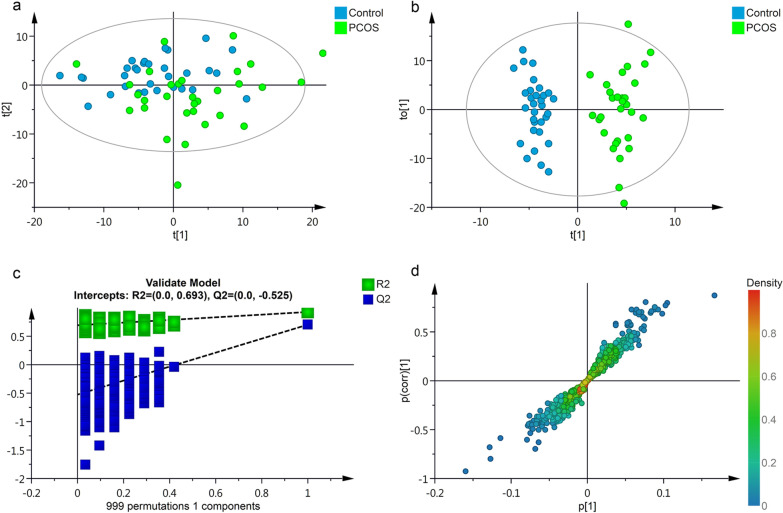
Fig. 1.
Multivariate statistical analysis of the serum metabolites in the study subjects. a unsupervised PCA score plots of metabolic phenotypes between PCOS and CON groups. Metabolomics data were log-transformed and scaled to unit variance for modeling. Model parameter: R2X = 0.86 (cumulative variance proportion of 9 principal components). b Score plot of OPLS-DA modeling to maximize inter-group differentiation of metabolomic data between PCOS and CON groups. Model parameter: 1 predictive component + 2 orthogonal component, R2Y = 0.93, Q2 = 0.70. c 999 times permutation test result of OPLS-DA modeling. d S-plot of OPLS-DA modeling

