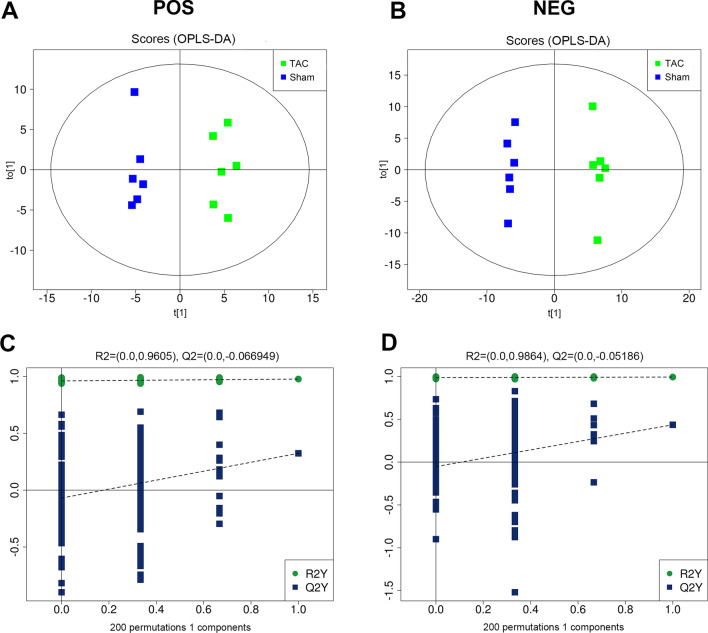
Fig. 2.
Metabolic pattern analysis by OPLS-DA score plot. A and B OPLS-DA score plot under positive- (A) and negative-ion modes (B). Blue circles indicate samples from the sham group (n = 6), and green circles indicate samples from the TAC group (n = 6). C and D Validated model plots obtained by permutation test: positive- (C) and negative-ion mode (D). OPLS-DA of the two-dimensional distribution patterns of the metabolites showed that in both positive- and negative-ion modes, significant separation of metabolite patterns was evident when the TAC group was compared with the sham group. The R2 and Q2 were 0.977 and 0.324 in positive modeand 0.993 and 0.435 in negative mode, respectively. OPLS-DA: orthogonal partial least squares discriminant analysis

