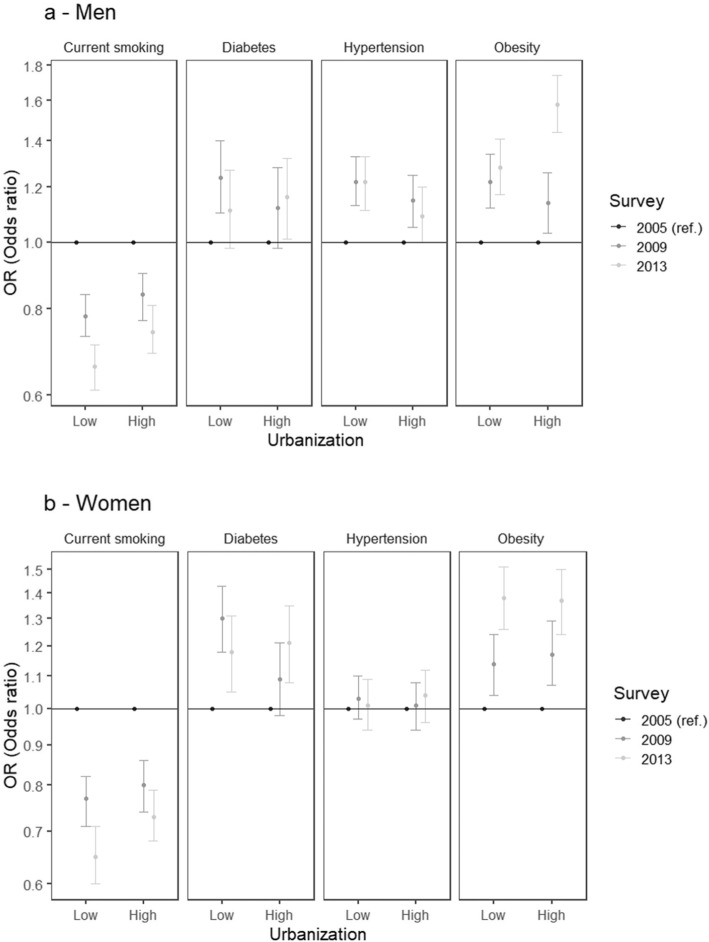
Fig. 1.
a and b. Adjusted odds ratios of hypertension, diabetes, obesity, and current smoking associated with survey year (with year 2005 as the reference) stratified by low (10th percentile) and high (90th percentile) province urbanicity in men (a) and women (b). Period 2005–2013. Model for each outcome includes all main effects and interaction for urbanicity and survey. Analyses are adjusted for age and education. Survey year 2005 is the reference category. Low and high province urbanicity correspond to 10th and 90th percentile, respectively. Significant p values for interactions include: Men, obesity (p = 0.001); Women, diabetes (p = 0.028)

