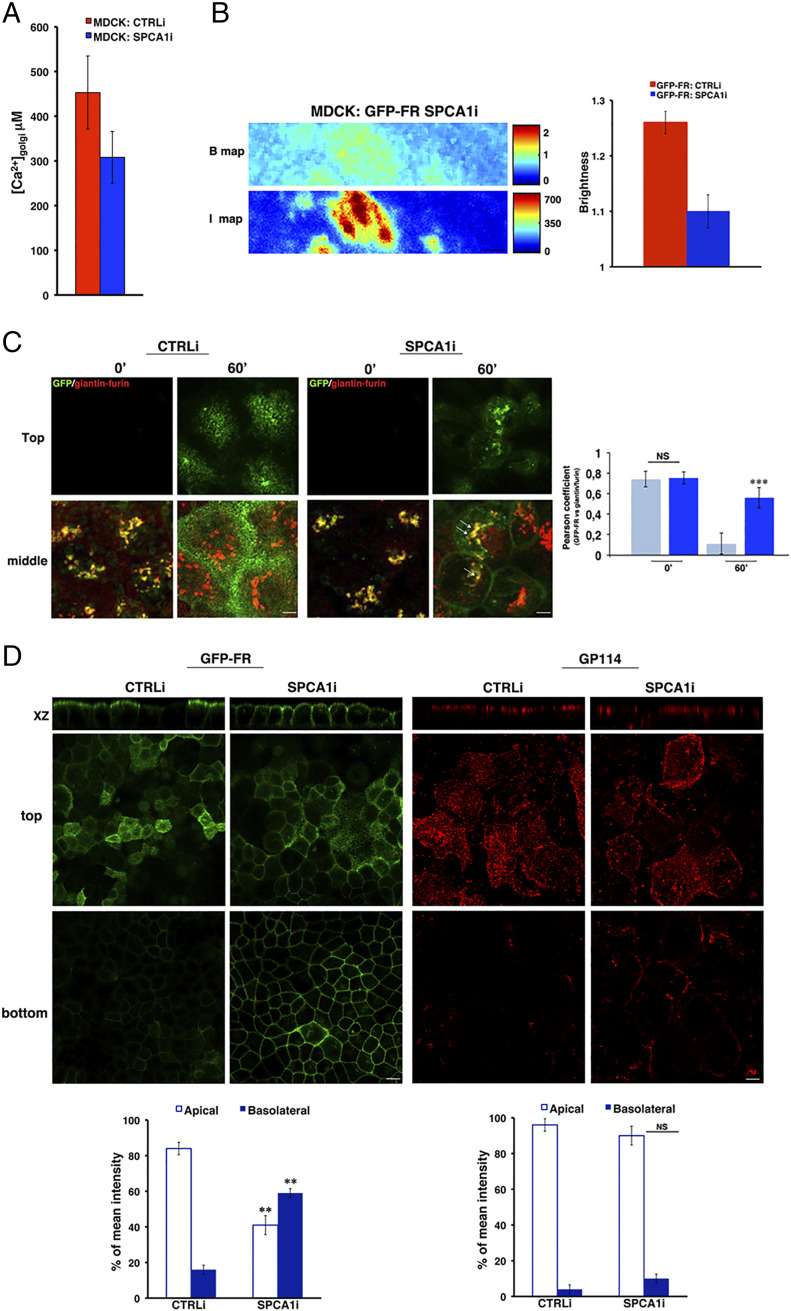
Fig. 3.
The loss of SPCA1 affects Golgi homoclustering and the sorting of GPI-APs. (A) Golgi [Ca2] quantification in MDCK:GFP-FR control-interfered (CTRLi) or SPCA1-interfered (SPCA1i) cells were measured following the same procedure described in Fig. 1C. The data represent the mean of four independent experiments performed in two knockdown clones. (B) N&B analysis of GFP-FR in the Golgi of CTRLi and SPCA1i cells. Representative B and I maps of SPCA1i cells are shown. (Scale bars, 0.9 μm.) Quantification of the brightness of GFP-FR in the Golgi compartment from three independent experiments either in CTRLi (red bar) or SPCA1i (blue bar) cells. (C) CTRLi and SPCA1i cells grown for 3 d on a coverslip were subjected to a temperature block (19.5 °C) to accumulate proteins in the TGN. Then, cells were warmed at 37 °C for the indicated times, fixed, and treated for confocal microscopy. Representative images taken at the top and at the middle of the cells are shown. Pearson’s coefficient between GFP-FR and giantin/furin is shown as mean of three different experiments (CTRLi, cyan bars; SPCA1i, blue bars), n > 60 cells. (Scale bars, 4 μm.) (D) CTRLi or SPCA1i cells grown for 4 d on a filter were imaged in live conditions or stained with anti-GP114 antibody. Mean fluorescence intensities at the apical and basolateral surface were measured and expressed as percentages of the total fluorescence. (Scale bars, 12 and 6 μm in GFP-FR and GP114 panels, respectively.) Error bars, ± SD; NS, not significant; **P < 0.01; ***P < 0.001, Student’s t test.

