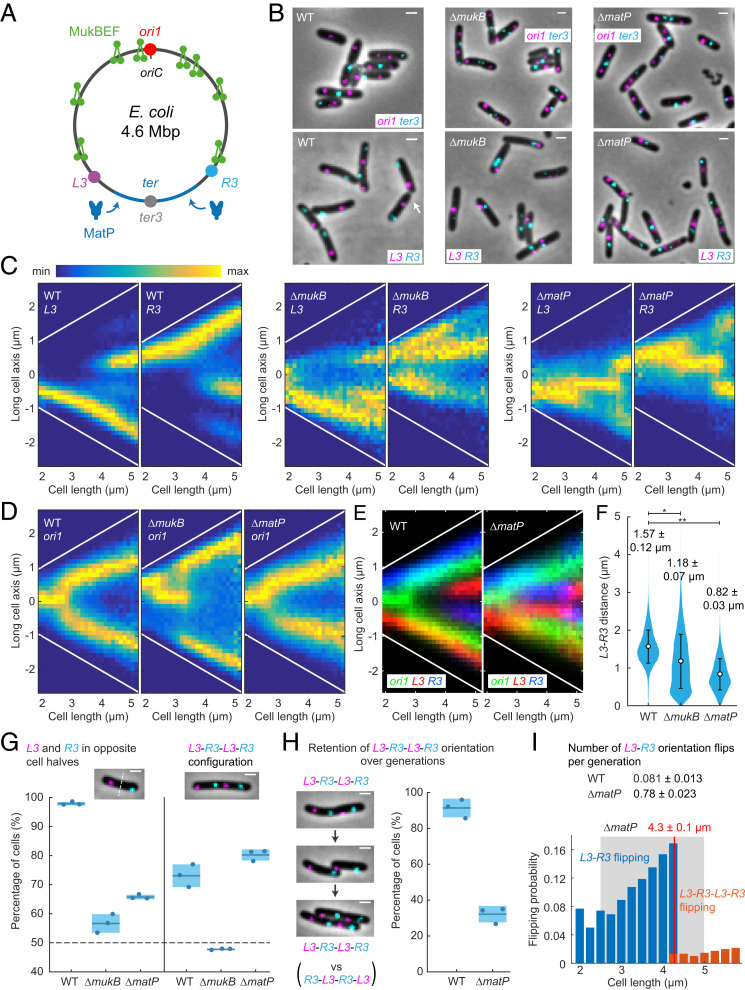
Fig. 2.
MukBEF and MatP action generates and propagates L-R chromosome organization in E. coli. (A) E. coli chromosome circular map with ori1, ter3, L3, and R3 loci. MukBEF complexes are displaced from the 800-kbp ter region by matS bound MatP. (B) Representative images of WT, ΔmukB, and ΔmatP cells with ori1 and ter3 or L3 and R3 FROS markers. Note an atypical R3-L3-L3-R3 configuration in WT (white arrow) in comparison to the standard L3-R3-L3-R3. (Scale bars, 1 μm.) L3 and R3 localizations (C) and ori1 localizations (D) along the long cell axis as a function of cell length in WT (L3-R3 57,509 cells and ori1 42,612 cells), ΔmukB (L3-R3 27,984 cells and ori1 54,820 cells), and ΔmatP (L3-R3 46,679 cells and ori1 51,350 cells). Sample numbers with different cell lengths were normalized by the maximum value in each vertical bin. Cells are oriented to place L3 more toward the negative pole (toward figure bottom) or, in the ori1 data, ter3 is oriented more toward the negative pole (SI Appendix, Fig. S2). White lines denote cell borders. (E) Overlay of ori1 and L3-R3 localization data in WT and ΔmatP from C and D. (F) Distance between L3 and R3 markers in WT (47,376 cells), ΔmukB (15,615 cells), and ΔmatP (41,625 cells) in single L3 and R3 focus cells. Mean and dispersion (SD) between experiments are shown above each distribution. Error bars denote SD of the cell population. * and ** denote two-sample t test of L3-R3 distances between WT and ΔmukB (P value 0.0081) and WT and ΔmatP (P value 5 × 10⁻⁴), respectively. (G, Left) Percentage of cells with L3 and R3 in opposite cell halves in single L3 and R3 focus cells (WT 47,376 cells, ΔmukB 15,615 cells, and ΔmatP 41,625 cells). (Right) Percentage of cells with L3-R3-L3-R3 (or R3-L3-R3-L3) configuration (versus L3-R3-R3-L3 or R3-L3-L3-R3) in double L3 and R3 focus cells (WT 10,352 cells, ΔmukB 2,535 cells, and ΔmatP 6,297 cells). The dashed horizontal line indicates random localization, assuming that each sister cell inherits a complete chromosome. (Scale bars, 1 μm.) (H) Percentage of cells retaining L3-R3-L3-R3 orientation (versus flipping to R3-L3-R3-L3) from a mother cell to a daughter cell in WT (859 pairs) and ΔmatP (1,054 pairs). (Scale bars, 1 μm.) (I, Top) Number of L3-R3 flipping events (±SD) to R3-L3 (or vice versa) during a cell cycle in WT (3,059 cells) and ΔmatP cells (4,102 cells) (SI Appendix, Fig. S2 I and J). (Bottom) Probability of L3-R3 flipping to R3-L3 (or vice versa) (blue) and L3-R3-L3-R3 flipping to R3-L3-R3-L3 (or vice versa) (orange) as a function of cell length in ΔmatP (10,362 cells). The flipping probability was normalized by the number of cells in each bin. The gray box indicates the replication period as a function of cell size from Fig. 3. The red vertical line indicates the average cell length at locus duplication (±SD between experiments). Data are from three repeats in all analyses.

