Fig. 4.
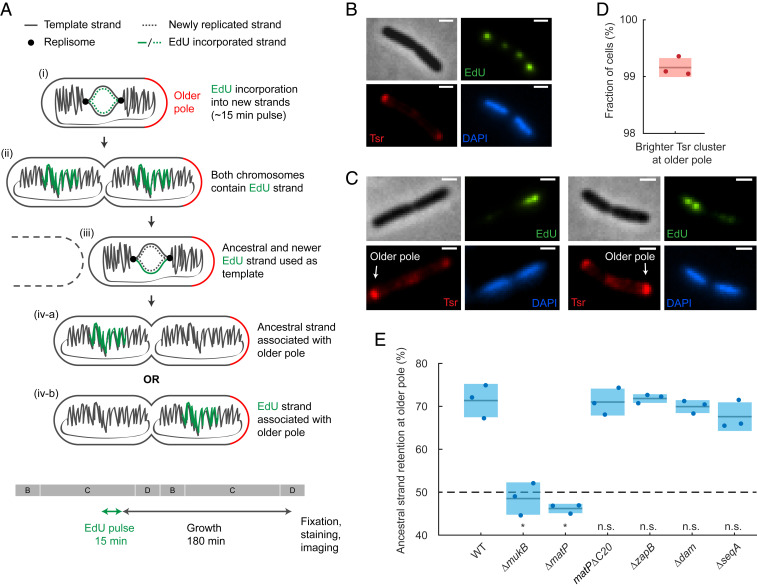
Visualization of ancestral DNA strand retention in E. coli. (A) Ancestral DNA strand propagation shown following an EdU pulse and the subsequent growth. After the second round of replication, only one of the chromosomes inherits the EdU label. Note that only a part of the chromosome is labeled with EdU. The 15-min EdU pulse and growth period are also shown relative to a schematic of cell-cycle stages (B, C and D periods; generation time ∼150 min). (B) Representative EdUAlexa488, TsrTMR, and DAPI images of a cell at stage (ii) (see A) after the EdU pulse. Note that each chromosome has two EdU foci because pulse-labeled chromosome arms are separated. (Scale bars, 1 μm.) (C) Representative EdUAlexa488, TsrTMR, and DAPI images after the complete pulse-chase protocol [stage (iv-a), see A]. The older pole is indicated with an arrow. (Scale bars, 1 μm.) (D) Accuracy of the older pole classification using Tsr prior to cell division. Shaded area denotes SD. Data are from 2,505 cells and three repeats. (E) Percentage of ancestral strand retained at the older pole in WT (988 cells), ΔmukB (427 cells), ΔmatP (1,050 cells), nondivisome-interacting matPΔC20 mutant (1,617 cells), ΔzapB (969 cells), Δdam (717 cells), and ΔseqA (473 cells). The dashed line shows random retention. P value from two-proportion, two-tailed z-test was used to test if binomial distributions significantly differ from WT; indicated by n.s. (>0.01, nonsignificant) and * (<0.01, significant) (P values <10−5, <10−5, 0.51, 0.83, 0.26, and 0.03, respectively). Shaded areas denote SD from three repeats.

