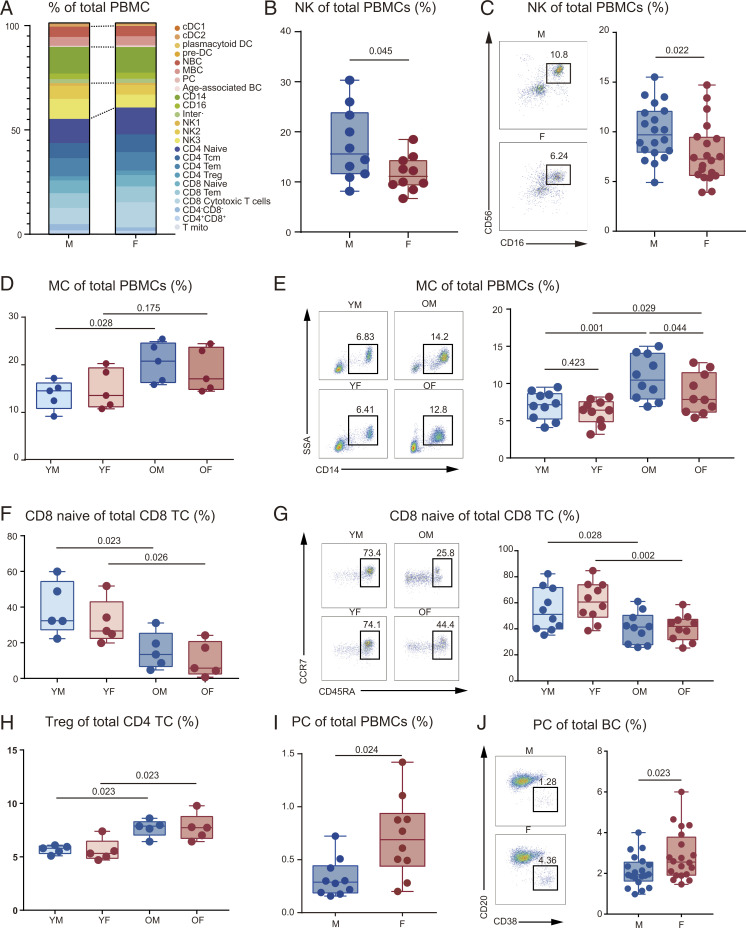
Fig. 2.
Changes in cell proportions associated with aging and sex. (A) Relative cluster abundance in males and females. Male group includes YM (n = 5) and OM (n = 5); female group includes YF (n = 5) and OF (n = 5). (B) Percentage of NK in PBMCs between males (n = 10) and females (n = 10). (C) Flow cytometry results for the proportion of NK in PBMCs between males (n = 20) and females (n = 20). The scatter plot is a statistical representation of the results. (D) Percentage of MC in PBMCs among the four groups (n = 5, per group). (E) Flow cytometry results for the proportion of MC in PBMCs among the four groups (n = 10, per group). The scatter plot is a statistical representation of the results. (F) Percentage of naïve CD8 TC in CD8 TC among the four groups (n = 5, per group). (G) Flow cytometry results for the proportion of CD8 naïve in CD8 TC among the four groups (n = 10, per group). The scatter plot is a statistical representation of the results. (H) Percentage of Treg in CD4 TC among the four groups (n = 5, per group). (I) Percentage of PC in PBMCs between males (n = 10) and females (n = 10). (J) Flow cytometry results for the proportion of PC in BC between males (n = 20) and females (n = 20). The scatter plot is a statistical representation of the results. Two-way ANOVA was used for the differences between sexes and age groups; F statistic and P value of sex, aging, and interaction could be seen in SI Appendix, Table S3; and false discovery rate (<5%) was corrected using the Benjamini–Hochberg method.

