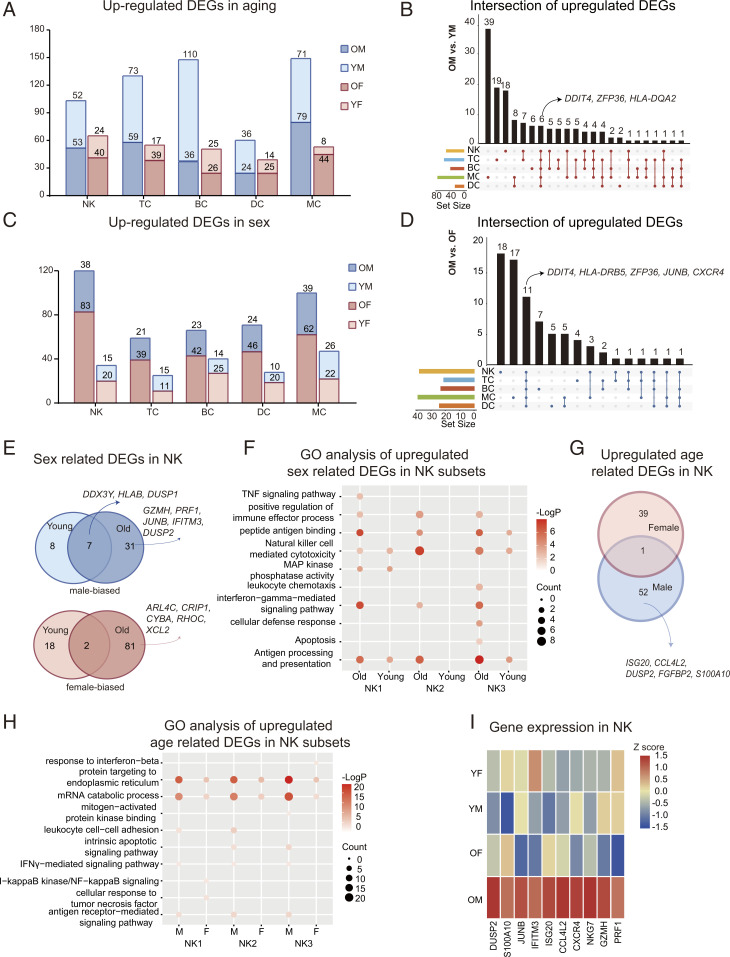
Fig. 3.
Changes in blood immune cell and NK cell transcriptional profiles. (A) Numbers of age-related DEGs (OM: YM and OF: YF) in the five immune cell subsets (see Dataset S4 for the gene lists). (B) Integrated comparative analysis of up-regulated DEGs in immune cell subsets between OM and YM. UpSet plots is an alternative to the Venn Diagram used to deal with more than three sets. (C) Numbers of sex-related DEGs (YM: YF and OM: OF) in the five immune cell subsets (see Dataset S5 for the gene lists). (D) Integrated comparative analysis of up-regulated DEGs in immune cell subsets between OM and OF. (E) Integrated comparative analysis of up-regulated (Top, male biased) and down-regulated (Bottom, female biased), sex-related DEGs in NK between young and old groups. (F) Representative GO terms and pathways enriched in up-regulated, sex-related DEGs, based on functional enrichment analysis in NK subsets of young and old. (G) Integrated comparative analysis of up-regulated, age-related DEGs in NK between females and males. (H) Representative GO terms and pathways enriched in up-regulated, age-related DEGs, based on functional enrichment analysis in NK subsets of males and females. (I) A heatmap representing scaled expression values of the 10 inflammatory genes in NK among groups.

