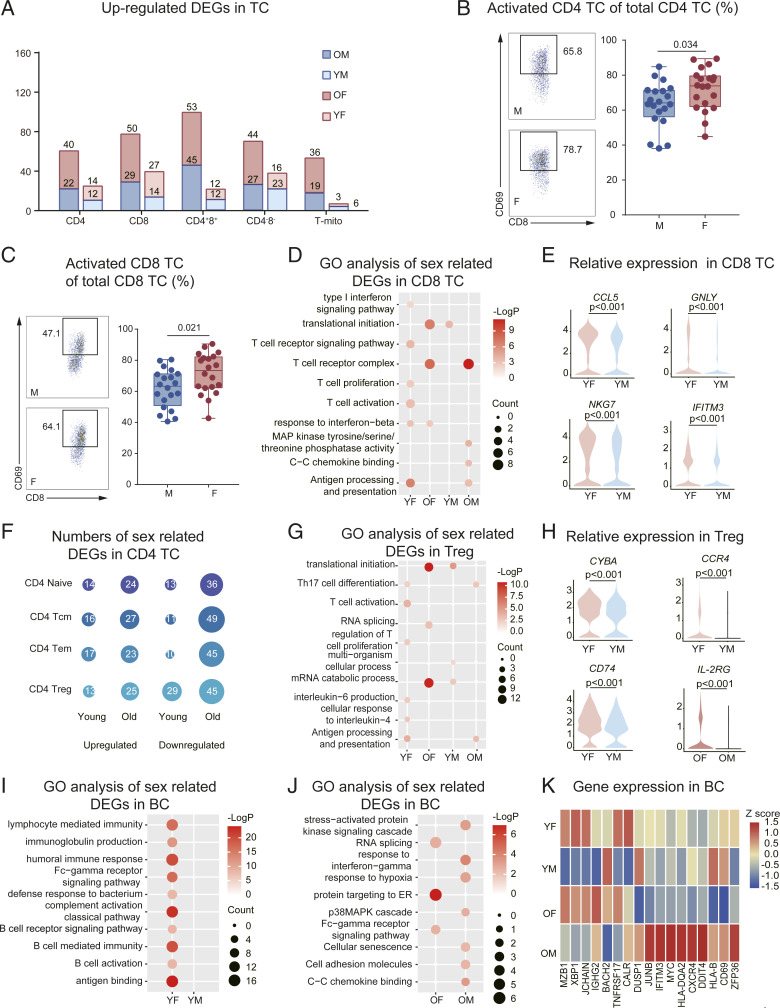
Fig. 4.
Changes in transcriptional profiles of TC and BC. (A) Numbers of sex-related DEGs (YM: YF and OM: OF) in the TC subsets (see Dataset S6 for the gene lists). (B) Flow cytometry results for the proportion of activated CD4 TC in CD4 TC between males (n = 20) and females (n = 20). The scatter plot is a statistical representation of the results. (C) Flow cytometry results for the proportion of activated CD8 TC in CD8 TC between males (n = 20) and females (n = 20). The scatter plot is a statistical representation of the results. (D) Representative GO terms and pathways enriched in sex-related DEGs, based on functional enrichment analysis in CD8 TC of the young and old groups. (E) Distribution of normalized expression levels of selected genes in the CD8+ TC cluster between YF and YM. (F) Numbers of sex-related DEGs in CD4+ TC subsets in the young and old groups. (G) Representative GO terms and pathways enriched in sex-related DEGs, based on functional enrichment analysis in Treg of the young and old groups. (H) Distribution of normalized expression levels of selected genes in Treg clusters between YF and YM, and IL2RG between OF and OM. (I) Representative GO terms and pathways enriched in sex-related DEGs, based on functional enrichment analysis in BC of the young group. (J) Representative GO terms and pathways enriched in sex-related DEGs, based on functional enrichment analysis in BC of the old group. (K) A heatmap representing scaled expression values of the seven BC markers (on the Left) and 10 inflammatory genes (on the Right) in BC among the four groups. Two-way ANOVA was used for the differences between sexes and age groups; F statistic and P value of sex, aging, and interaction could be seen in SI Appendix, Table S3; and false discovery rate (<5%) was corrected using the Benjamini–Hochberg method.

