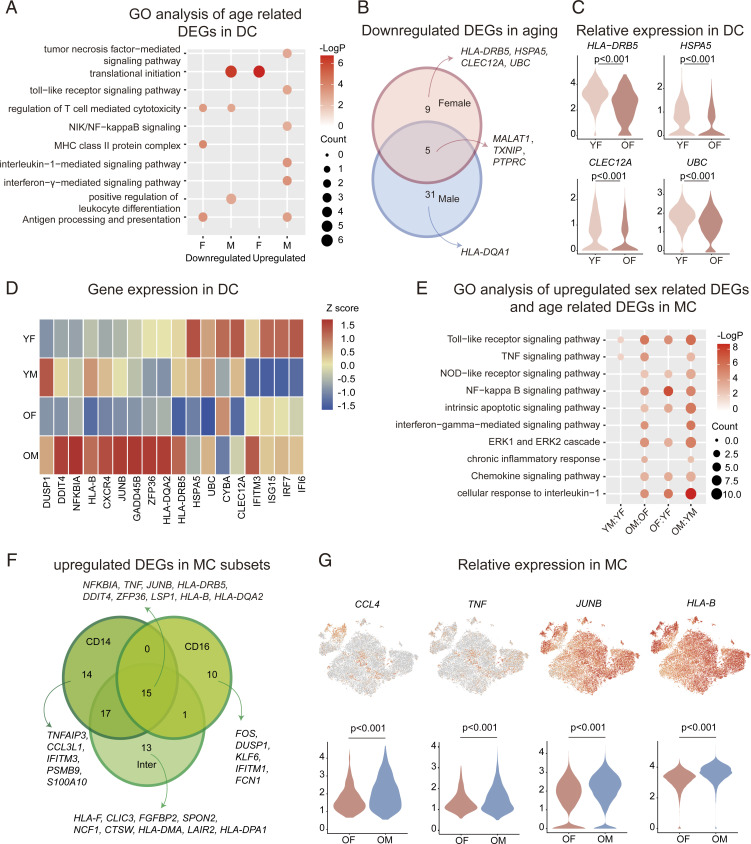
Fig. 5.
Changes in DC and MC transcriptional profiles. (A) Representative GO terms and pathways enriched in age-related DEGs, based on functional enrichment analysis in DC of females and males. (B) Integrated comparative analysis of down-regulated, age-related DEGs in BC between females and males. (C) Distribution of normalized expression levels of selected genes in the DC cluster between YF and OF. (D) Heatmap representing scaled expression values of the 10 inflammatory genes (on the Left) and eight DC markers (on the Right) in DC among all the groups. (E) Representative GO terms and pathways enriched in up-regulated, sex-related DEGs and age-related DEGs, based on functional enrichment analysis in MC. (F) Integrated comparative analysis of up-regulated (male biased), sex-related DEGs in MC subsets. (G) Expression of selected genes was projected onto the t-SNE plot and are shown as violin plots. Violin plots are showing the distribution of normalized expression levels of selected genes in the MC cluster between OF and OM.

