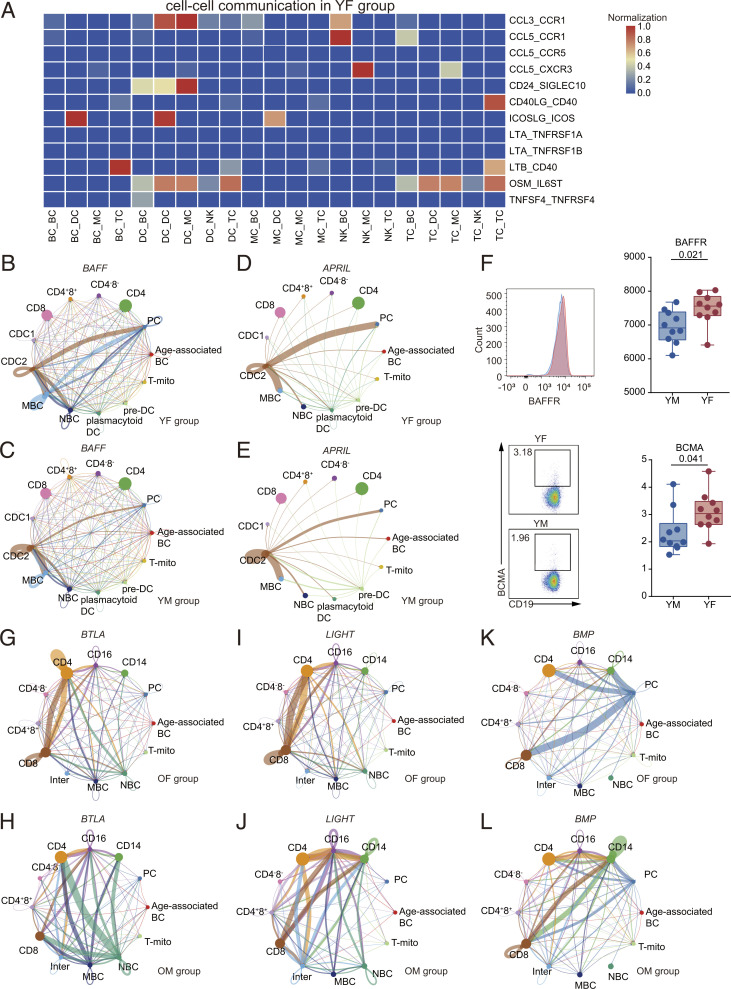
Fig. 6.
Heterogeneous, sex-based differences in cell–cell communication. (A) A heatmap depicting selected cell–cell interactions enriched in YF but absent in YM. (B) Inferred BAFF signaling networks in YF (circle plot). (C) Inferred BAFF signaling networks in YM. (D) Inferred APRIL signaling networks in YF. (E) Inferred APRIL signaling networks in YM. (F) Flow cytometry results for the proportion of BAFFR and BCMA of BC between YM and YF. The scatter plot is a statistical representation of the results. (G) Inferred BTLA signaling networks in OF. (H) Inferred BTLA signaling networks in OM. (I) Inferred LIGHT signaling networks in OF. (J) Inferred LIGHT signaling networks in OM. (K) Inferred BMP signaling networks in OF. (L) Inferred BMP signaling networks in OM.

