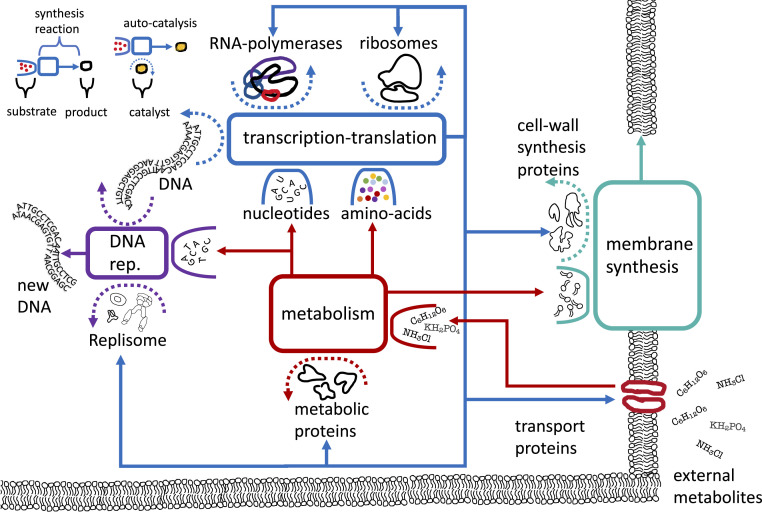
Fig. 1.
Schematic diagram of a bacterial autocatalytic network, showcasing different autocatalytic cycles coarsely grained. The top left corner shows an explanation of the graphical notation, following ref. 6. A reaction node is marked by a square. Substrates consumed by the reaction are depicted inside open boxes. Catalysts that drive a reaction, but are not consumed by it, are depicted inside dashed curved arrows. Each arrow emanating from a reaction node points to product of the synthesis reaction. In an autocatalytic reaction, the synthesized products themselves serve as the catalysts that drive the reaction. In Methods, we explain how this graphical notation is translated to a set of coupled ODEs, from which we derive the growth laws by solving for the steady growth condition. In the main figure, we present a schematic autocatalytic reaction network for an entire cell. The transcription–translation machinery consumes raw materials and energy (not shown) and produces copies of all the proteins, including copies of itself. DNA is replicated by the replisome machinery, using the existing DNA as a template . Metabolic proteins import and convert external metabolites into nucleotides, amino acids, fatty acids, and other metabolites. The membrane is synthesized by the membrane synthesis proteins. Thus, four major autocatalytic cycles are shown in this coarse-grained picture—the autocatalysis of the transcription–translation machinery, of the DNA, of metabolism, and of the membrane. All these autocatalytic cycles are coupled by the transcription–translation machinery.

