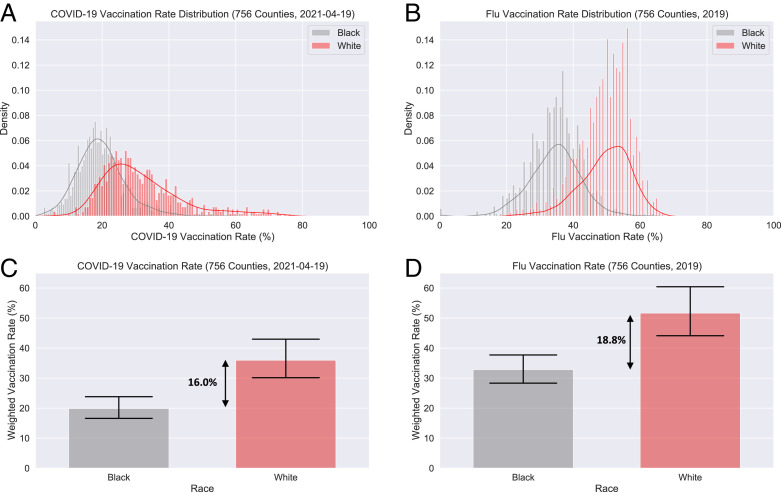
Fig. 1.
(A) Distribution of county-level COVID-19 vaccination rates by race (19 April 2021). (B) Distribution of county-level flu vaccination rates among Medicare beneficiaries for the year 2019 by race. (C) Weighted average of Black and White rates for COVID-19 vaccination and their disparity. (D) Weighted average of Black and White rates for flu vaccination and their disparity. Error bars represent 95% confidence intervals.

