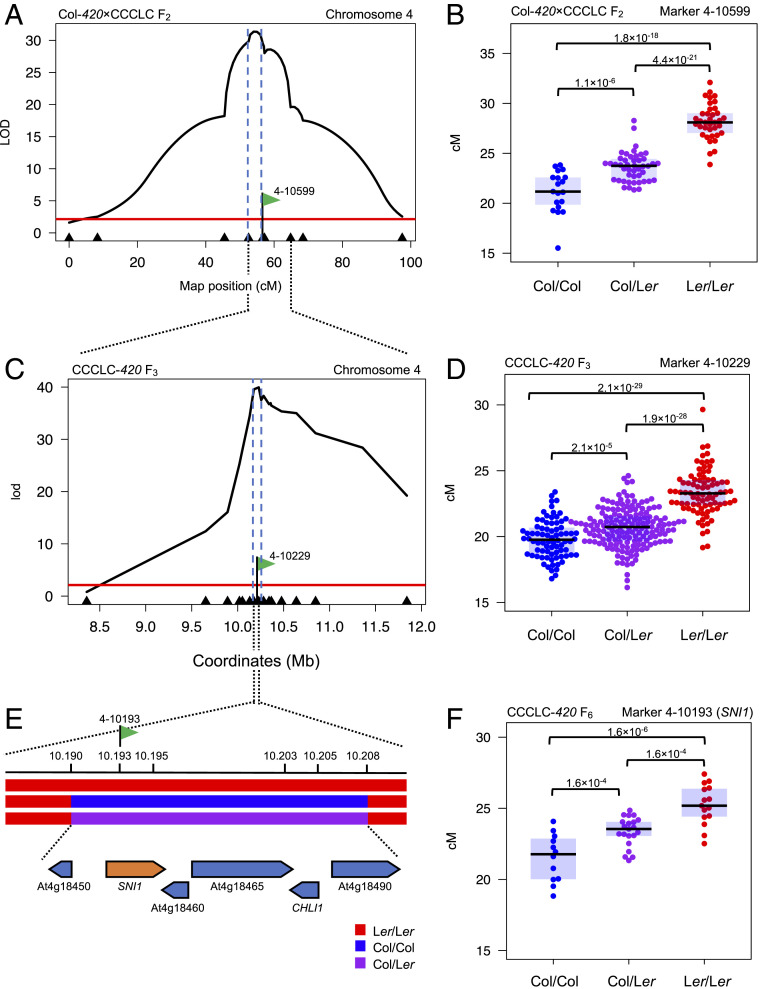
Fig. 1.
Fine-mapping of the rQTL4 recombination modifier locus. (A) LOD scores for markers associated with 420 crossover frequency from Col-420×CCCLC F2 population. The x axis corresponds to the chromosome 4 genetic map with markers used for mapping indicated by arrowheads. The red line indicates the 95% significance threshold, and blue dashed lines mark the credible interval. The marker 4–10599 is labeled with a green flag. (B) Effect plots showing 420 crossover frequency for Col/Col, Col/Ler, and Ler/Ler individuals for the marker 4-10599 in the F2 population. Each dot represents one individual. P values were estimated by Welch t test. (C) As in A but showing the Col-420×CCCLC F3 population. The x axis corresponds to chromosome 4 physical positions (Mb). The marker 4-10229 is labeled with a green flag. (D) As in B but for the marker 4-10229 in the F3 population. (E) The genotypes of progeny of the H-27 recombinant plant, which has only a 19.5-kb region segregating for Col/Ler and the reminder of the genome being fixed. Gene models are shown beneath the genotypes. The marker 4-10193 is labeled with a green flag. (F) As in B but for the marker 4-10193 in the progeny of the H-27 F5 recombinant.

