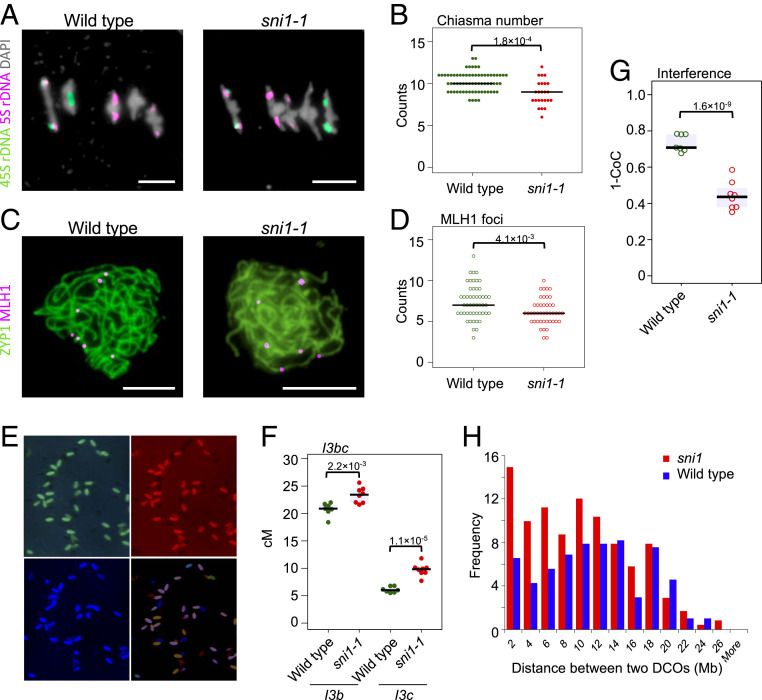
Fig. 4.
The sni1-1 mutant shows weakening of crossover interference. (A) Representative images of DAPI-stained bivalents at metaphase I in wild type (Col) and sni1-1. FISH probes against 45S (green) and 5S (red) ribosomal DNA were used to identify chromosomes, allowing for chiasma counting depending on chromosome morphology. (Scale bar, 5 μm.) (B) Quantification of chiasma count data from wild type and sni1-1. Significance was assessed by Mann–Whitney–Wilcoxon (MWW) tests. (C) Representative images of pachytene stage male meiocytes from wild type (Col-420) or sni1-1 stained for MLH1 (red) and ZYP1 (green). (Scale bar, 5 μm.) (D) Quantification of MLH1 foci on pachytene stage meiotic chromosomes in wild type and sni1. Significance was assessed by MWW tests. (E) Microphotographs of segregating I3bc pollen grains as seen in three fluorescent channels. Composite image was also shown. (F) I3b and I3c genetic distances in wild type and sni1-1. Each dot represents measurements from four to 10 pooled individuals. Significance was assessed by Welch t tests. (G) Crossover interference (1–CoC) between the I3b and I3c intervals. (H) Histograms of cis-DCO distances in Col×Ct (blue) and Colsni1-1×Ctsni1-2 (red) calculated in 2-Mb windows. Frequency was scaled to the number of F2 individuals in each population.

