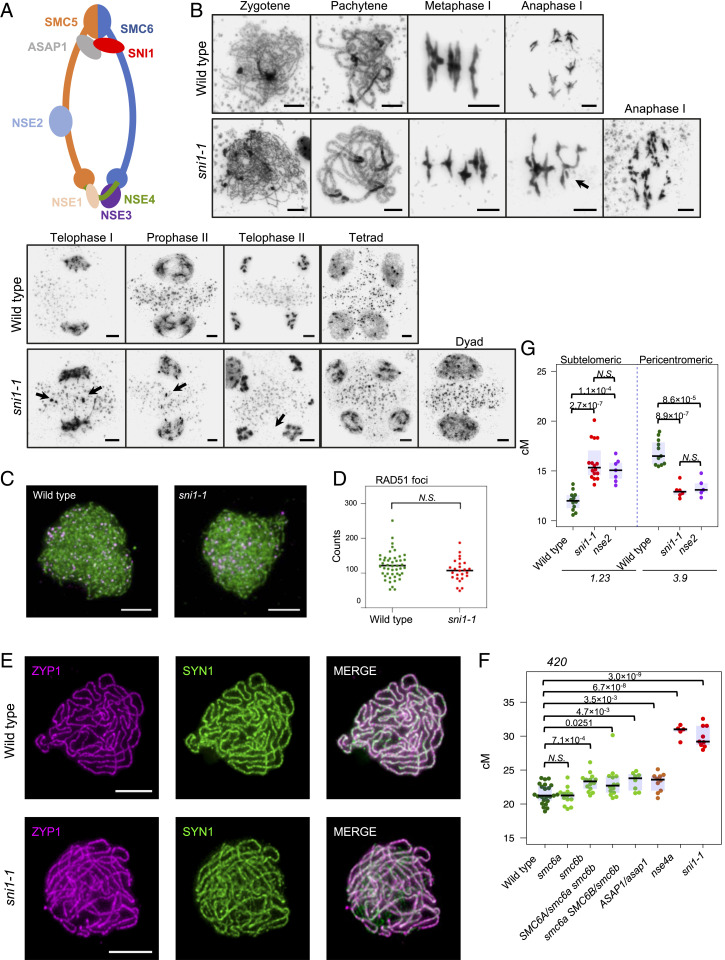
Fig. 5.
The meiotic phenotype of the sni1 mutant is similar to SMC5/6 complex mutants. (A) Schematic representation of SMC5/6 complex. The interface of the protein interaction of the SNI1–ASAP1 subcomplex (gray–red) is unknown in plants. (B) Cytological characterization of the sni1 mutant in comparison to wild type (Col). The stages of meiotic progression were labeled. Chromosome fragments and micronuclei observed in the sni1 mutant are indicated by arrows. (Scale bar, 5 μm.) (C) Representative images of ASY1 (green) and RAD51 (magenta) coimmunostaining on wild type (Col-420) and sni1-1 male meiocytes at zygonema. (D) Quantification of RAD51 foci number per cell in wild type and sni1-1. (E) Representative images of ZYP1 (magenta) and SYN1 (green) coimmunostaining on wild type (Col-420) and sni1-1 male meiocytes at pachynema. (Scale bar, 5 μm.) (F) 420 crossover frequency in SMC5/6 complex mutants. (G) CTL1.23 and CTL3.9 genetic distances (cM) in wild type, sni1-1, and nse2-2. Significance in D through F was assessed by Welch t test; each dot represents one individual.

