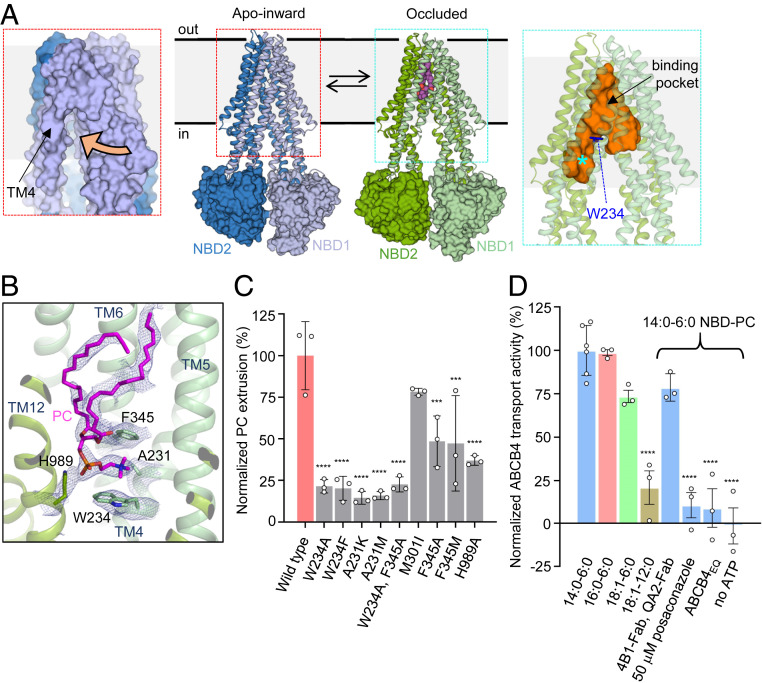
Fig. 1.
Structure of wild-type ABCB4 and functional analysis. (A) Structures of apo-inward and occluded ABCB4 (Center), with TMDs shown as ribbons and NBDs as surfaces. The N- and carboxyl-terminal halves of ABCB4 are colored differently. Bound phosphatidylcholine is shown as purple spheres. (Left) Close-up of the apo-inward conformation shown as a surface representation. The side opening to the inner leaflet of the membrane is indicated by an orange arrow. (Right) Close-up of the occluded conformation. The central cavity, generated with HOLLOW (47), is shown as an orange surface. The phosphatidylcholine binding pocket is located above the residue W234, shown as blue sticks. The asterisk depicts the area termed the access tunnel in the related ABCB1 protein (16). (B) Binding pocket of PC molecule in occluded conformation. Bound PC and interacting residues are shown as sticks; EM density is shown as blue mesh. (C) Normalized PC extrusion rates from HEK293T cells expressing wild-type or mutant ABCB4. The results are normalized to the amount of ABCB4 extracted from the membranes relative to wild-type ABCB4. Means of measurements from at least three biological replicates are shown; error bars represent SDs. Statistical significance was determined using Dunnett’s test. Differences between wild-type and mutants were depicted as *P ≤ 0.05; **P ≤ 0.01; ***P ≤ 0.001; ****P ≤ 0.0001. (D) Normalized in vitro transport activity of wild-type ABCB4. Proteoliposomes contained liver polar lipid extract and cholesterol (4:1 wt/wt) supplemented with 0.3% (wt/wt) NBD-PC. Numbers refer to the alkyl tail lengths and the number of double bonds. Data were normalized to the highest transport rate. Means of measurements from at least three independent proteoliposomes-based samples are shown; error bars represent SDs. Statistical significance was determined using Dunnett’s test. Differences between 14:0 and 6:0 NBD-PC condition and other samples were depicted as *P ≤ 0.05; **P ≤ 0.01; ***P ≤ 0.001; ****P ≤ 0.0001.

