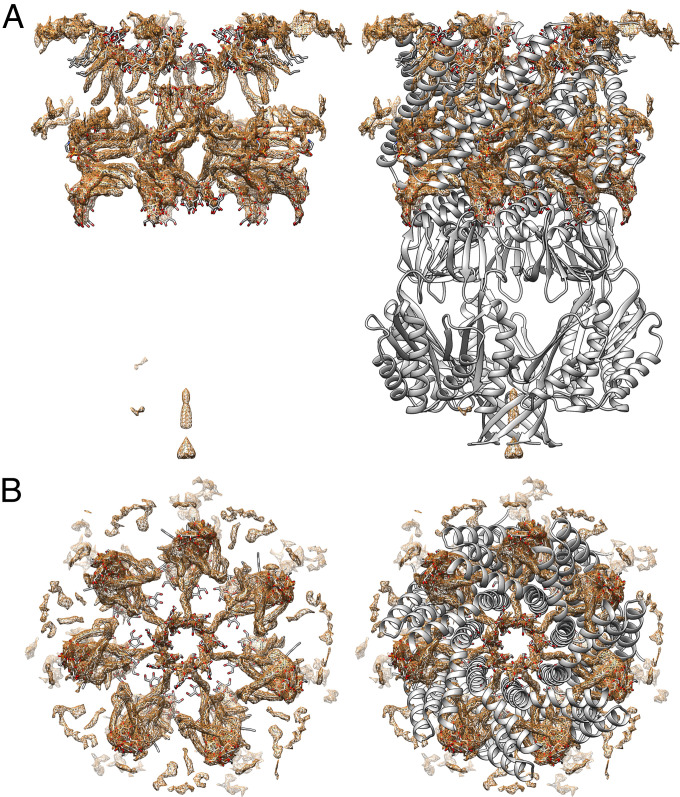
Fig. 3.
Difference map of open MscS in LMNG (condition 2b). (A) Difference map after subtraction of protein density showing elongated densities (brown). The interpretation of these densities as lipids and detergent molecules is shown in stick representation (oxygen: red, nitrogen: blue, carbon: gray). Close-ups are shown in Fig. 4. On the right side a model of the protein in cartoon representation is also shown (gray). (B) View along the symmetry axis from the cytosol. On the right side with the protein model, the view was cut in the height of TM3b for clarity.

