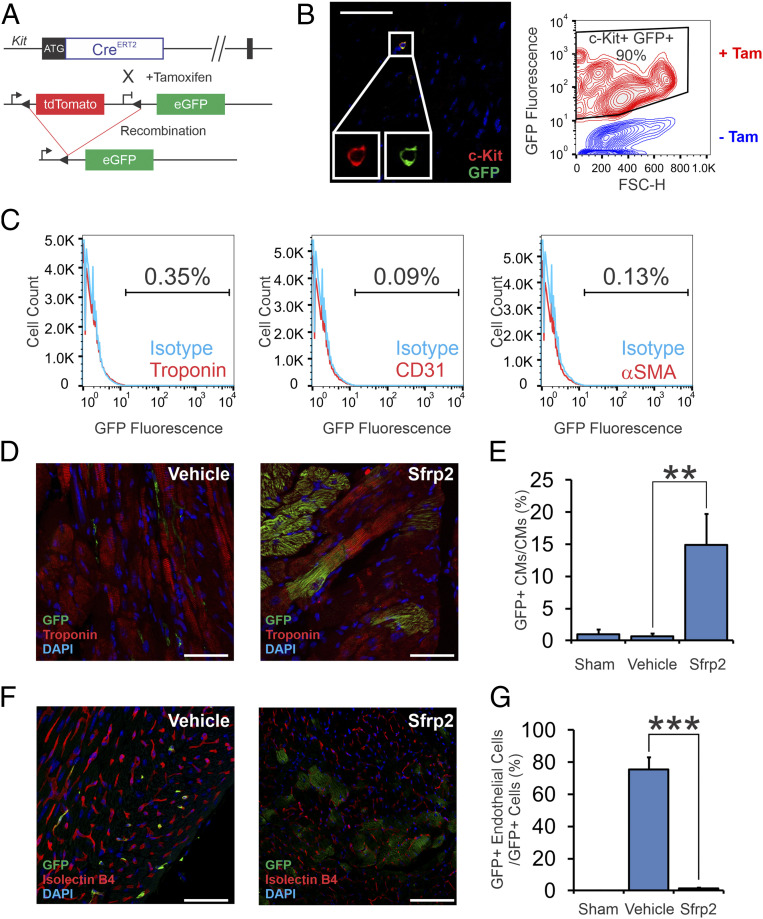
Fig. 1.
Sfrp2 induces cardiomyogenesis in vivo. (A) Description of the cKit(+) lineage tracing mouse. cKitCreERT2/mTeG mice, where the cKit promoter drives the expression of a tamoxifen-inducible Cre, were used. This transgenic mouse that carries a Cre-ERT2 expression cassette inserted into the ATG start codon of the endogenous cKit locus was generated by homologous recombination. Upon tamoxifen treatment, Cre-mediated recombination at the LoxP sites allows expression of eGFP exclusively in cKit(+) cells. (B) Heart tissue was analyzed for eGFP expression in cKit(+) cells by confocal microscopy (Left) and flow cytometry (Right). (Left) Heart tissue from tamoxifen-treated mice was stained with cKit and GFP antibodies and then visualized by confocal microscopy. (Scale bar, 100 μm for representative confocal microscopy images.) Images are from three separate animals. (Right) Heart tissue from vehicle or tamoxifen-treated mice was digested by collagenase, and the resulting single cell suspension was analyzed for cKit and eGFP expression by flow cytometry. CKit(+) cells represented <0.001% of the total population in the heart. Considering the rarity of these cells, a contour plot was used to visualize what is a very small population. (C) Hearts were digested with collagenase. The resulting single cell suspension was analyzed for eGFP expression in cardiomyocytes, endothelial cells, and smooth muscle cells via flow cytometry. (D) Expression of eGFP [cKit(+) cells and cells derived thereof] and the cardiac marker cardiac troponin-T was analyzed by confocal microscopy. Representative confocal images are shown. (Scale bar, 50 μm.) (E) Quantification of D. n = 7 for vehicle-treated group, and n = 10 for Sfrp2-treated group; ANOVA with Bonferroni post hoc tests. Significance shown: **P < 0.01. (F) Cardiac tissue was analyzed for coexpression of GFP and the endothelial cell–specific stain isolectin B4. Representative confocal images are shown. (Scale bar, 50 μm [vehicle] and 100 μm [Sfrp2].) Individual channels are shown in SI Appendix, Fig. S1B. (G) Quantification of F. n = 7 for vehicle-treated group, and n = 10 for Sfrp2-treated group; ANOVA with Bonferroni post hoc tests. Significance shown: ***P<0.001.

