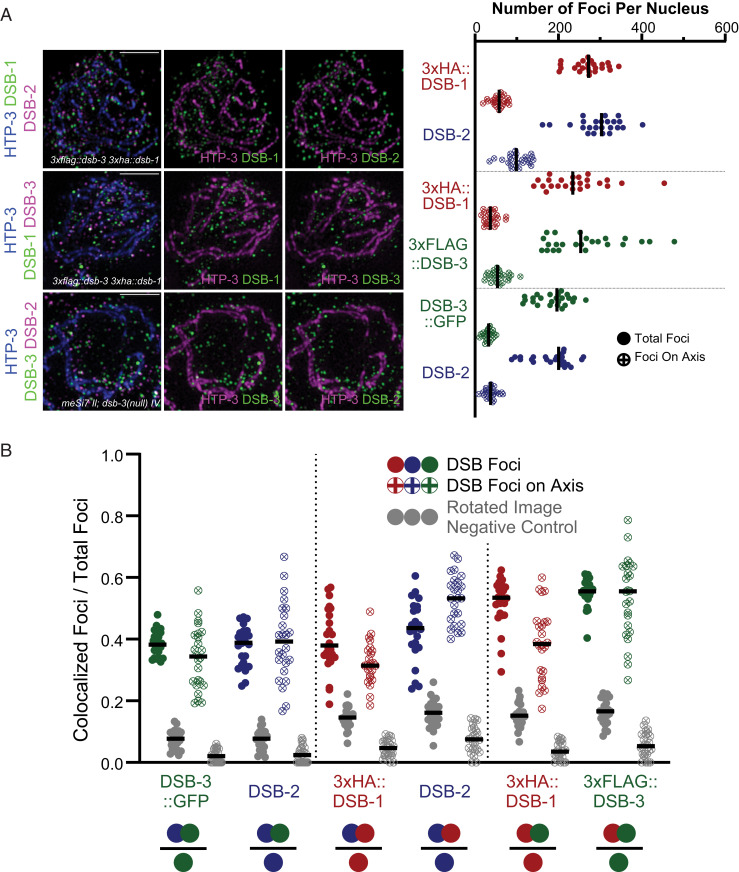
Fig. 6.
The presence and colocalization of DSB-3, DSB-2, and DSB-1 are not confined to the meiotic chromosomal axis. (A, Left) Representative maximum-intensity projections of SIM images, representing the middle third of Z-stacks collected for the depicted spread nuclei. Nuclei were stained with antibodies targeting DSB proteins and the axis component HTP-3. (Scale bars: 2 µm.) (A, Right) Graph showing quantification of numbers of DSB protein foci that colocalize with the axis signal, as well as the total numbers of DSB protein foci identified in the analyzed nuclei. (B) Graphs depicting the fractions of colocalized foci/total foci for DSB protein foci of the indicated types (represented as in Fig. 5), reported for axis-associated foci and for total nuclear foci analyzed within the same datasets. The filled dots represent colocalization fractions for all DSB protein foci of a given type within the nucleus, and dots with crosses represent the colocalization fractions for the subset of DSB protein foci of the indicated type that colocalize with the axis.

