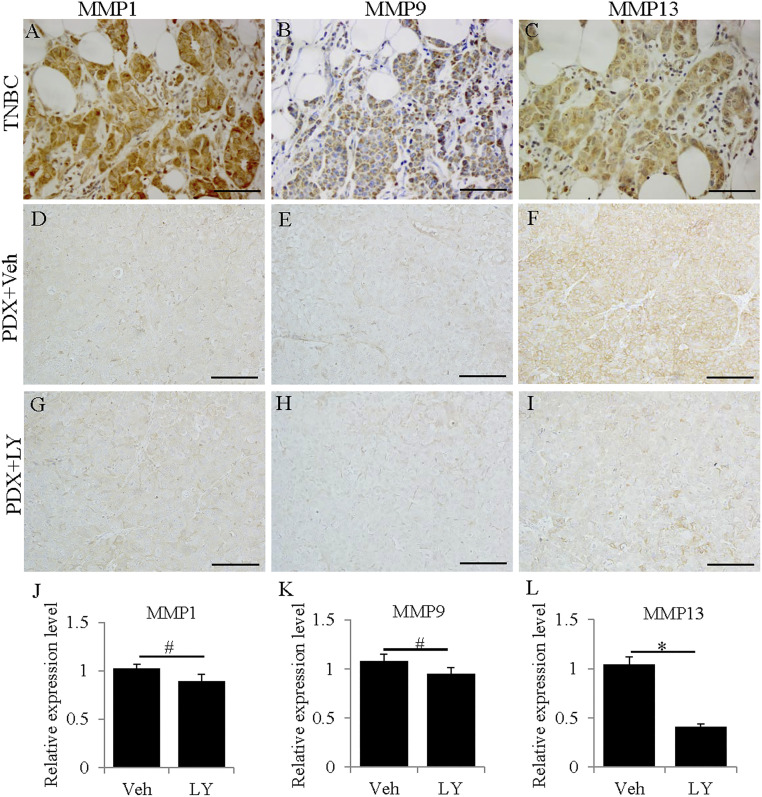
Fig. 1.
Expression of MMPs in TNBCs and TNBC PDXs. MMP1, 9, and 13 were highly expressed in TNBC patient samples (A–C). MMP1 (D and G) and MMP9 (E and H) were weakly expressed in TNBC PDX samples and were not significantly changed by LY500307 treatment (J and K) (#P > 0.05). MMP13 (F and I) was highly expressed in TNBC PDXs and was significantly down-regulated by LY500307 treatment (L) (*P < 0.05). (J–L) Error bars represent standard deviations. (Scale bars, 100 μm.)

