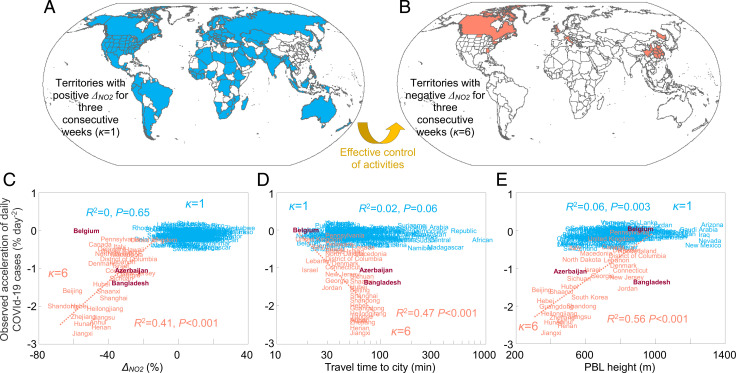
Fig. 3.
Relationship between the weekly acceleration of daily COVID-19 cases (A) and socioeconomic and environmental indicators. (A and B) Spatial distribution of territories with the upper bound (mean + SE) of ΔNO2 (ΔNO2+) being positive (blue, κ = 1) (A) or negative (red, κ = 6) (B) for 3 wk before one week in 2020. (C–E) The observed weekly acceleration of daily COVID-19 cases (A) is plotted against the estimated ΔNO2 (C), the average travel time of residents to the nearest urban center (D), and the PBL height as an indicator of air advection (E). Each indicator is averaged for weeks in a territory where the upper bound (mean + SE) of ΔNO2 (ΔNO2+) is positive (blue, κ = 1) or negative (red, κ = 6) for 3 wk before these weeks. The reported COVID-19 cases in Azerbaijan, Bangladesh, and Belgium were suspected to be biased and excluded from our analysis (Materials and Methods).

