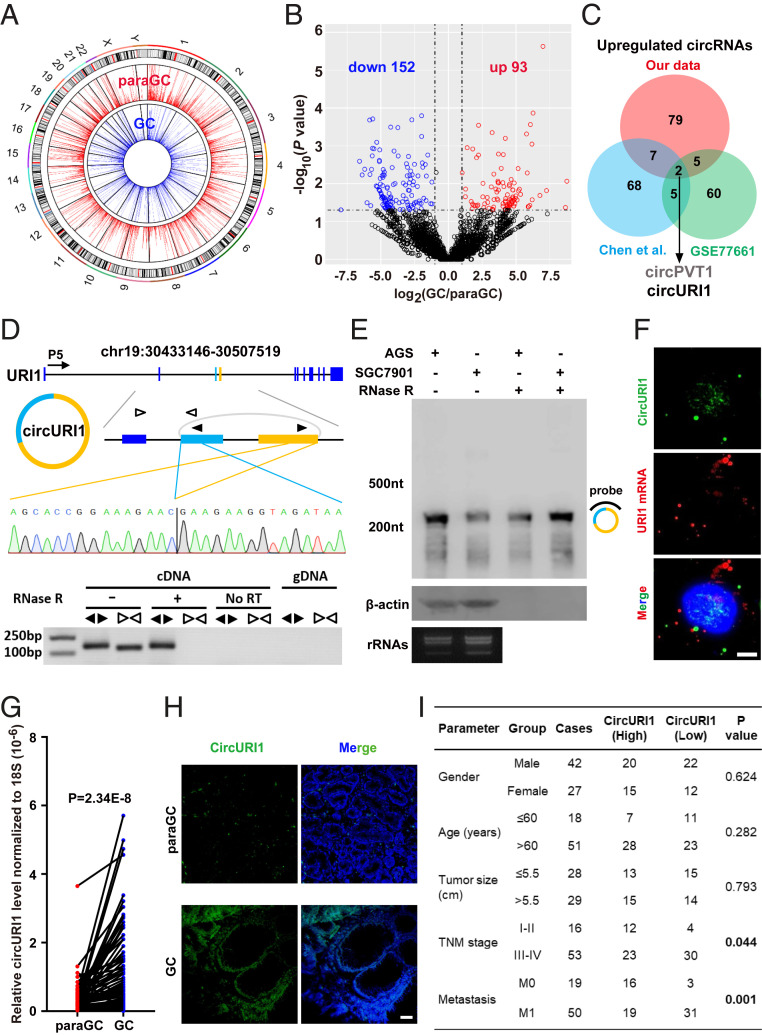
Fig. 1.
Identification of circURI1 in GC. (A) Circos plots showing the distribution of circRNAs in the human genome (hg19). CircRNAs with BRPM greater than 0.2 were chosen for analysis. The outer tracks represent the cytoband ideogram of the chromosome. (B) Volcano plots illustrating differential changes of circRNAs in GC versus paraGC samples. Blue and red dots represent significantly down-regulated and up-regulated circRNAs, respectively. (C) Venn diagram revealing the overlap of up-regulated circRNAs from two published datasets and our RNA-seq data in GC. Chen et al. (19) identified circRNA transcripts from three paired normal and cancerous gastric tissues, whereas GSE77661 contained RNA profiling data of one paired cancer specimen and adjacent normal tissue from a GC patient. Datasets from both Chen et al. and GSE77661 were sequenced on a 100-bp paired-end run, and our dataset was generated on a 150-bp paired-end run. (D) The genomic loci and validation of circURI1. The putative unique back-spliced junction fragment of circURI1 (divergent primers) was performed in AGS cells by RT-PCR and validated by Sanger sequencing. P5 indicates the direction of transcription. gDNA, genomic DNA. (E) Northern blot analysis showing circURI1 in AGS and SGC7901 cells. The hybridized probe against the back-spliced junction site is indicated on the right of the blot image. β-actin mRNA was the positive control for RNase R treatment. rRNA bands are presented to indicate equal loading. (F) RNA FISH of circURI1 (green) with the probe antisense to the back-spliced junction indicated in the same region of Northern Blot (D) and URI1 mRNA (red) in AGS cells. Nuclei (blue) were stained with 4, 6-diamidino-2-phenylindole. (Scale bars, 20 μm.) (G) RT-qPCR analysis of circURI1 in 69-paired GC and paraGC samples. P value was calculated by two-tailed Student’s t test. (H) RNA FISH of circURI1 (green) in GC and paraGC tissues. (Scale bars, 1 μm.) (I) Relationship between circURI1 expression and clinicopathologic factors of GC patients. P values were calculated by χ2 test. Error bars indicate SEM from three independent experiments.

