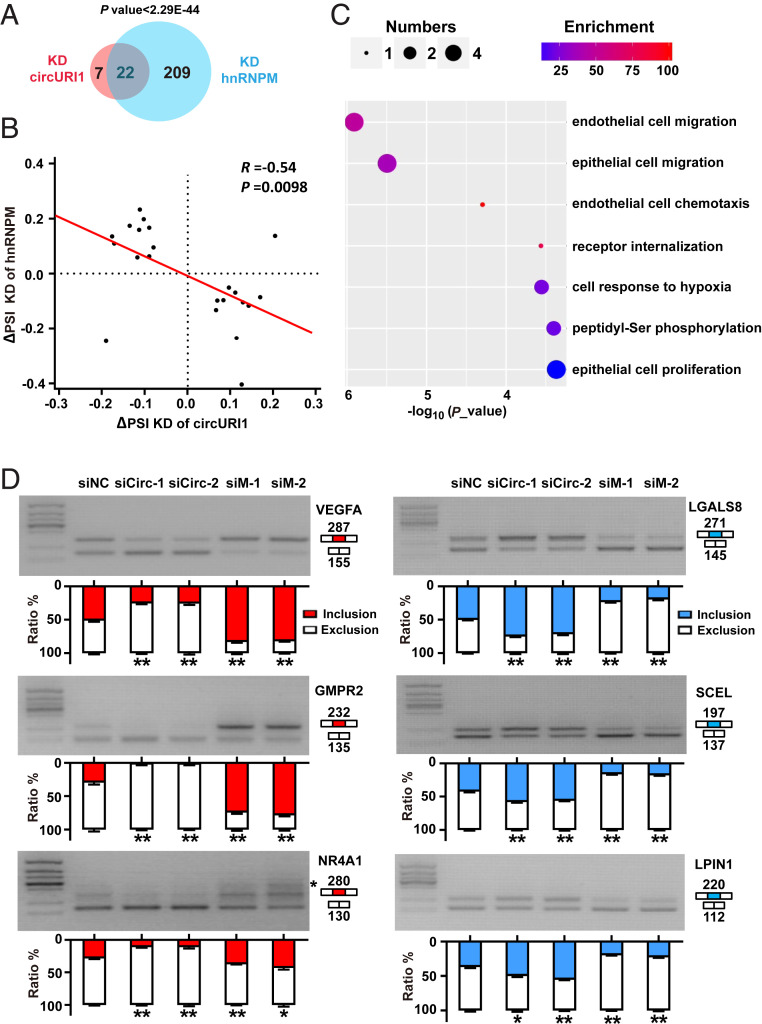
Fig. 6.
The effects of circURI1 and hnRNPM on alternative splicing. (A) Venn diagram illustrating the overlap of altered alternative splicing events upon depleting circURI1 or hnRNPM in AGS cells. P value was calculated by χ2 test. (B) Correlation plot of ∆PSI for exons sensitive to both circURI1 and hnRNPM. The PSI was used to calculate the changes in alternative splicing. R represents Spearman’s correlation coefficient, and the P value was calculated by Spearman’s correlation test. (C) Gene Ontology analysis of both circURI1 and hnRNPM-sensitive targets analyzed by Gorilla. (D) Semi-quantitative RT-PCR validation of both circURI1 and hnRNPM-sensitive exons upon knockdown of circURI1 or hnRNPM in AGS cells. For NR4A1, an unspecific band is also amplified (indicated with a star). siNC, siRNA with scrambled sequences; siCirc-1 and siCirc-2, two siRNAs against the junction sites of circURI1; siM-1 and siM-2, two independent siRNAs against hnRNPM. Error bars indicate SEM from three independent experiments. *P < 0.05; **P < 0.01 by two-tailed Student’s t test.

