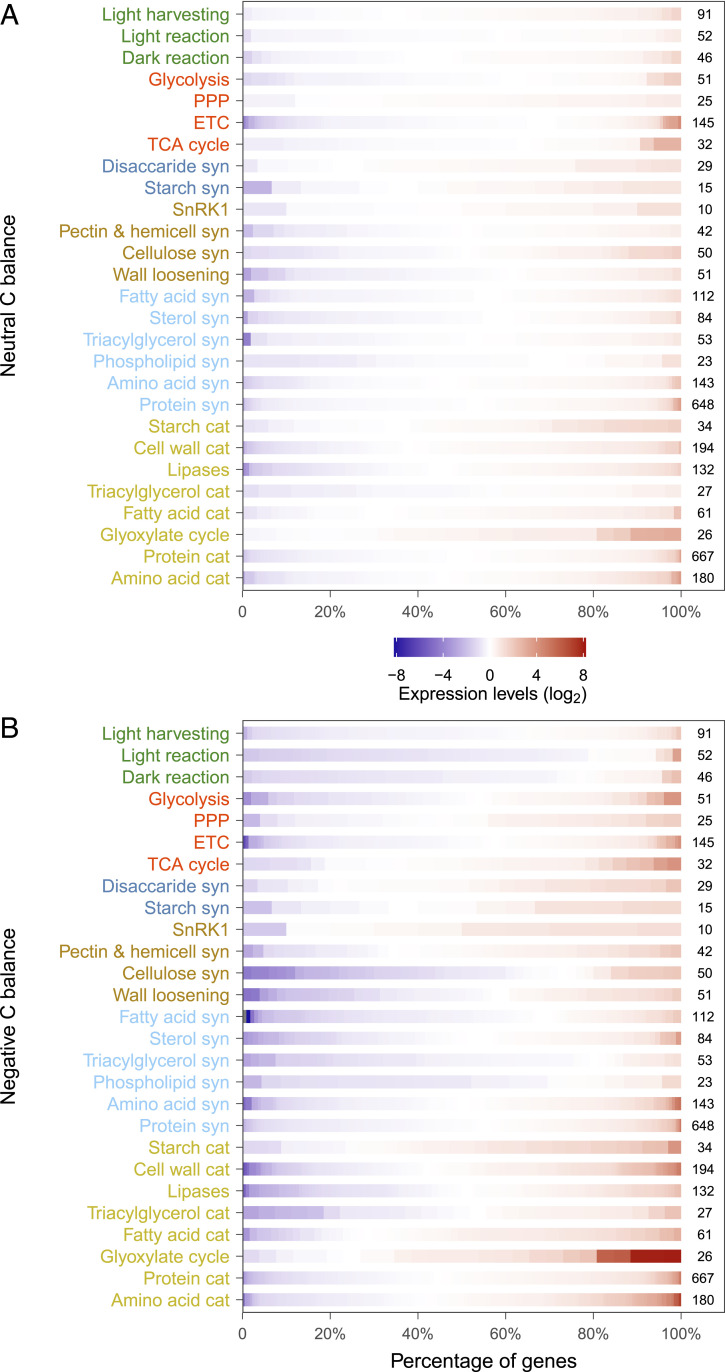
Fig. 3.
Transcriptional regulation of source and sink activities under declining carbon balance. Changes in the gene expression patterns for current-year-young leaves under neutral (A) and negative carbon (C) balance (B), relative to control (positive C balance) at week 4. Figures showing expression of individual genes for individual pathways at higher resolution can be found in SI Appendix, Figs. S1 and S2. Each bar is composed of a number of genes (small boxes) with different expression patterns, starting from the repressed genes (blue) on the left side to the induced ones (red) on the right side. The number of genes identified for each pathway is listed at the end of the bar. The pathways are grouped based on their functions and indicated by the colors of axis labels: photosynthesis (green), respiration (red), NSC synthesis (dark blue), growth (brown), alternative substrate synthesis (light blue), and storage catabolism (yellow). Note that the width of nested genes of each pathway is adjusted so as to compare the overall expression patterns of different pathways. Full information about the sequence ontology is given in SI Appendix, with a detailed description of the gene expression in SI Appendix. Abbreviations: Cat, catabolism; ETC, electron transport chain; PPP, pentose phosphate pathway; Syn, synthesis; and TCA, trichloroacetic acid.

