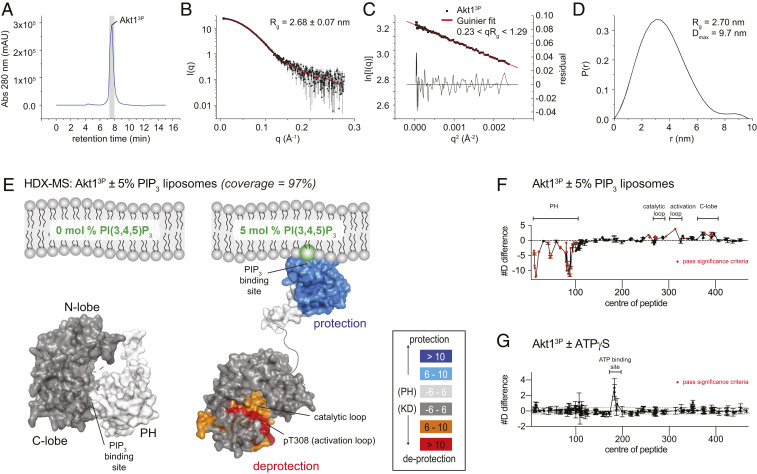
Fig. 4.
Phosphorylation alone does not drive Akt into an active conformation. (A) Size-exclusion profile of Akt13P from in-line SEC-SAXS data collection. Gray bar indicates the region of the chromatogram evaluated in the SAXS data processing. (B) SAXS curve of Akt13P. Radius of gyration (Rg) derived from Guinier analysis of the low-angle scattering regime. (C) Guinier plot of the low-angle SAXS regime for Akt13P. (D) Pair distribution function for Akt13P, indicating the radius of gyration (Rg) and maximum dimension of the particle (Dmax). (E) Hydrogen-deuterium exchange mass spectrometry analysis of Akt13P in the presence of liposomes containing 0 or 5 mol % PI(3,4,5)P3. Regions of Akt13P that showed significant increases or decreases in exchange (meeting the three criteria: ≥6% change in exchange, ≥0.4 Da difference in exchange, and a P value <0.01 using a two-tailed Student’s t test) upon PIP3 binding are mapped on the structures of the PH domain and the active kinase domain (PDB ID 4EKK) (16) with the corresponding color scheme. (F) Plot of differences in deuterium incorporation upon PIP3 binding. Changes in deuterium incorporation are plotted against the center of each peptide. Regions of protection and deprotection are indicated above the plot and correspond to those mapped in E. Error bars indicate the SD of three independent replicates. Red data points indicate increases or decreases in exchange that passed the three significance criteria. (G) Plot of changes in deuterium incorporation upon ATPγS binding. Changes in deuterium incorporation are plotted against the center of each peptide. Regions of protection and deprotection are indicated above the plot. Error bars indicate the SD of three independent replicates. No changes were deemed significant according to the three significance criteria.

