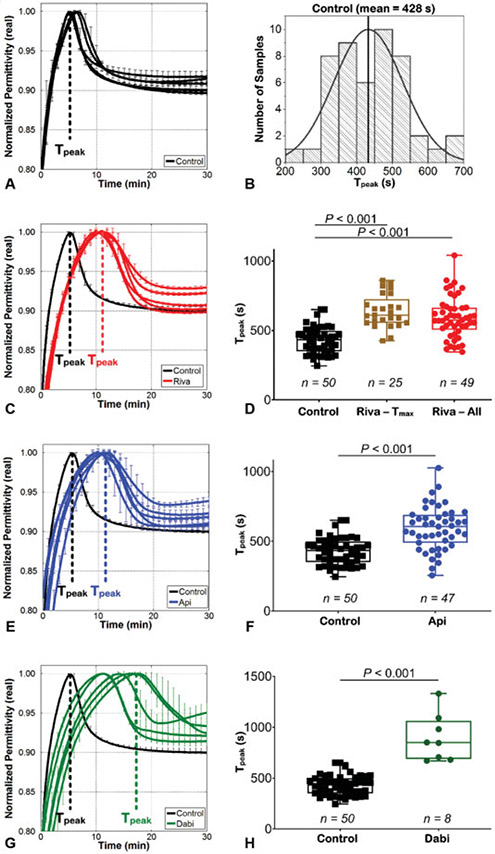
Fig. 3.
ClotChip measurements. (A) Representative ClotChip curves from five healthy volunteers. For all curves of the ClotChip readout, error bars indicate duplicate measurements. (B) Normal distribution of time-to-peak permittivity (Tpeak) for the control group (mean = 428 seconds; 95% confidence interval [CI] of the mean: 401–455 seconds; n = 50). (C) ClotChip readout from five patients on rivaroxaban showed prolonged Tpeak (representative curves in red) compared with the curve from a healthy volunteer (indicated in black). Error bars indicate duplicate measurements. (D) ClotChip Tpeak measurements from rivaroxaban samples drawn at time of peak plasma rivaroxaban concentration (defined as Tmax, n = 25) and cumulative values from all rivaroxaban samples drawn at peak and trough plasma drug levels (Riva – All, n = 49) versus control samples (n = 50). Each dot represents the mean of ClotChip measurements run in duplicate for each individual sample. Box-and-whiskers diagrams extend from each quartile to the minimum/maximum distribution. The horizontal line represents the median. *p < 0.001. (E) Representative ClotChip curves are shown for five apixaban samples drawn from patients at predicted peak plasma drug levels. Error bars indicate duplicate measurements for each sample. (F) Tpeak measurements for all apixaban samples (n = 47) versus control samples (n = 50). *p < 0.001. (G) Representative ClotChip measurements, run in duplicate, from patients on therapeutic dabigatran. (H) Quantitative representation of dabigatran Tpeak measurements (n = 8) versus control (n = 50). *p < 0.001.

