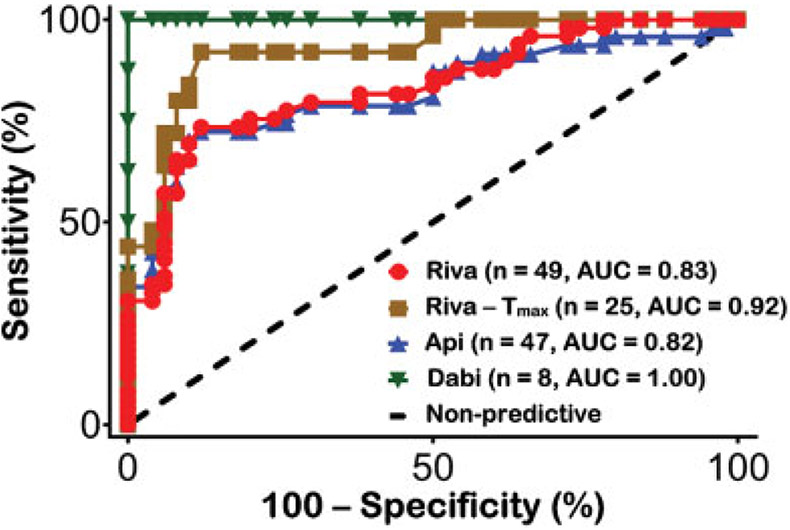
Fig. 6.
Receiver operator characteristic (ROC) curves of the ClotChip Tpeak parameter for detection of DOAC anticoagulant effects. ROC curves were generated using statistical software to determine the true-positive rate (sensitivity) and false-positive rate (100% – specificity). The area under the curve (AUC) for ClotChip Tpeak was 0.92 (95% CI: 0.86–0.98, p < 0.01) for rivaroxaban samples drawn at peak drug levels (n = 25, brown squares) and 0.83 (95% CI: 0.75–0.91, p < 0.01) for all rivaroxaban samples drawn at peak and trough drug levels (n = 49, red circles). For apixaban, AUC for Tpeak was 0.82 ([95% CI: 0.73–0.91, p < 0.01]; n = 47, blue triangles), whereas AUC was 1 for dabigatran ([95% CI: 1–1, p < 0.01]; n = 8, green inverted triangles). CI, confidence interval.

