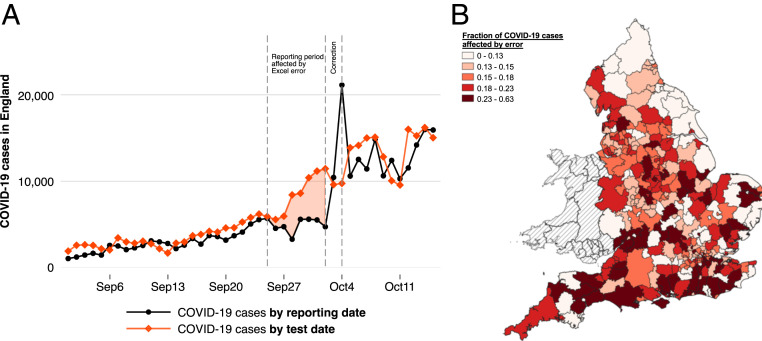
Fig. 1.
Evolution of COVID-19 in England and regional variation in contact tracing delays due to the Excel error. (A) COVID-19 cases in England separately by date of test and by reporting date. The reporting date equals the date on which a case is referred to the national contact tracing system. Reported cases trail behind actual positive case numbers due to a normal reporting lag. Reported and actual cases notably diverge during the time in which the Excel error occurred, highlighted by the area shaded in red. (B) For each local authority district, we calculate the fraction of all local COVID-19 cases with test dates between September 20 and September 27, 2020, that were referred to contact tracing with an unusual delay of 6 to 14 d due to the Excel error. The different color shades represent different quintiles of the distribution of this fraction measure. The map shows substantive heterogeneity in how strongly different areas were affected.

