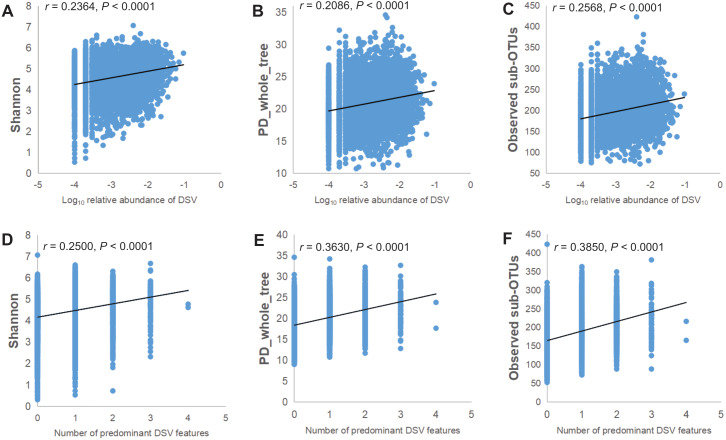
Figure 3. Microbial community α-diversity indices linked with DSV.
(A–C) Spearman rank correlations between Log10 relative abundance of DSV and Shannon index,PD_whole_tree index, and Observed sub-OTUs. (D–E) Spearman rank correlations between the number of predominant DSV features and Shannon index, PD_whole_tree index, and Observed sub-OTUs.

