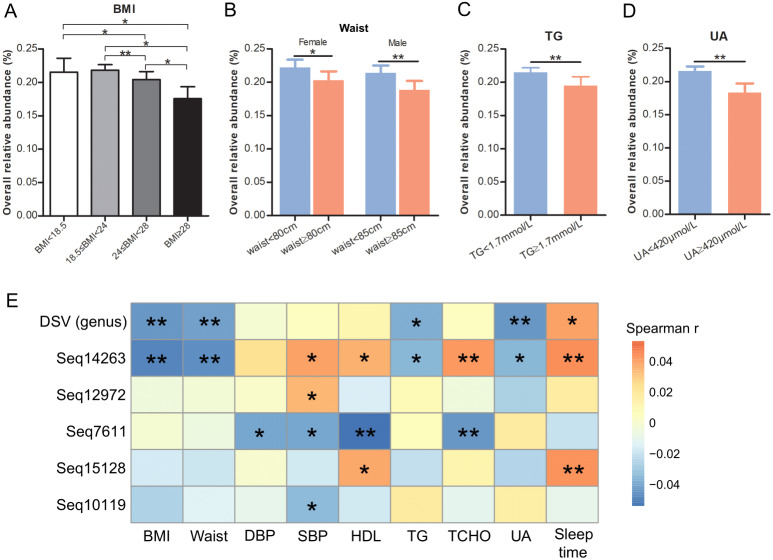
Figure 5. Relationships of DSV relative abundance and host metadata.
Relative abundance of DSV in people with different BMIs (A), waist size (B), TG levels (C), and UA levels (D). (E) Heatmap of Spearman rank correlation coefficients gathering correlations between host parameters and DSV (at the genus and sub-OTU levels). An asterisk (*) indicates FDR adjusted P values smaller than 0.05; Two asterisks (**) indicate FDR-adjusted P-values smaller than 0.01; and three asterisks (***) indicate FDR-adjusted P-values smaller than 0.001.

