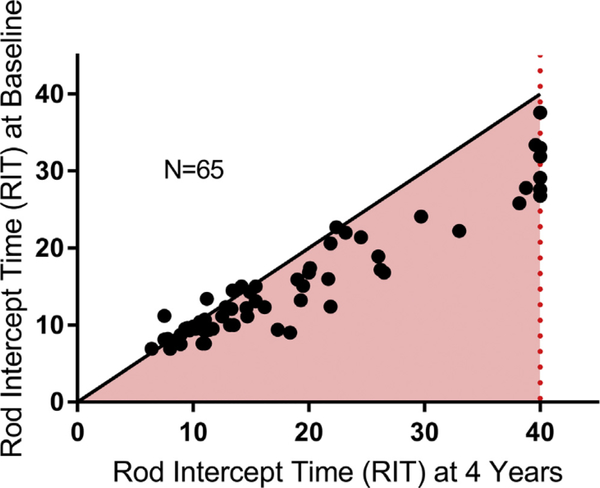
Figure 2.
Scatterplot of study eyes followed on the standard 5° dark adaptation (DA) protocol. The dashed line represents the test ceiling of rod intercept time (RIT) = 40 minutes. Points in the pink shaded region represent study eyes that have worsening of DA function at 4 years compared with baseline. Points with greater baseline RIT are farther from the diagonal demonstrating greater prolongation compared with eyes with lower baseline RITs.

