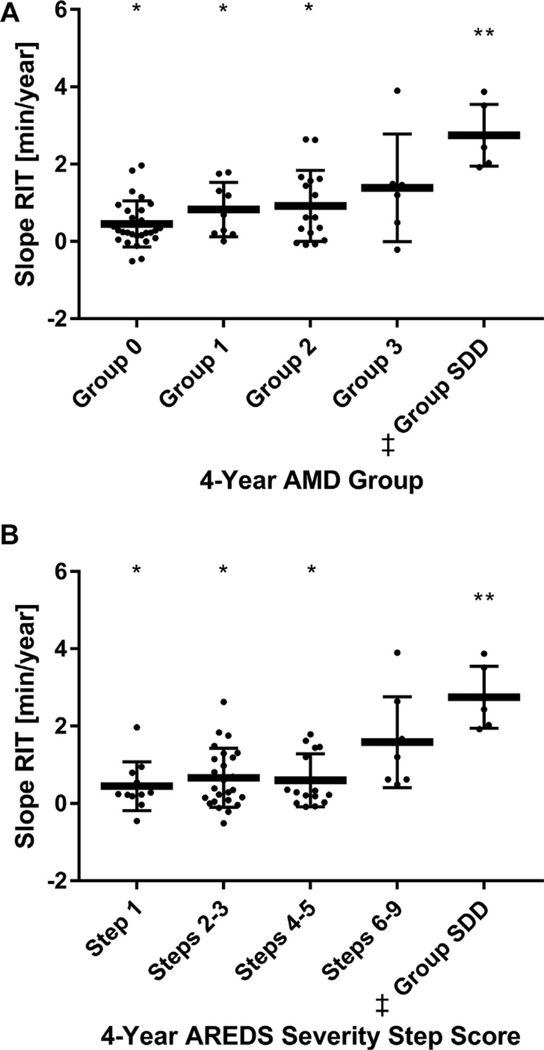
Figure 4.
A, Scatterplot showing mean slope rod intercept time (RIT) ± SD measured on the standard dark adaptation (DA) protocol by 4-year age-related macular degeneration (AMD) groups. ‡One Patient included in group suhretinal drusenoid deposit (SDD) at 4 years had SDD at baseline hut was not shown in Figure 3A. *P < 0.05 for comparisons with group SDD. **P < 0.05 for comparisons with Group 0. B, Scatterplot showing mean slope RIT ± SD measured on the standard DA protocol by 4-year groupings using the 9-scale AREDS severity step score. ‡One patient included in group SDD at 4 years had SDD at baseline but was not shown in Figure 3B. *P < 0.05 for comparisons with group SDD. **P < 0.05 for comparisons with Step 1.

