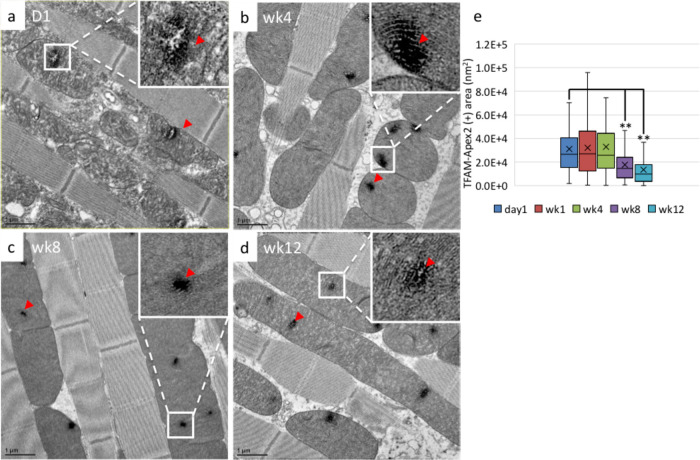
Fig. 2.
Small mtNucleoids become more prevalent as flies age. Apex2-staining EM images of the IFM of TFAM-Apex2 flies at day 1 (A), week 1 (B), week 4 (C), and week 12 (D). Red arrowheads indicate TFAM-Apex2 signals. (E) The size distributions of TFAM-Apex2 staining in flies of different ages were plotted in a box-and-whisker graph. The t-test was performed and statistically significant differences between indicated groups are marked with asterisks (n=106–164; **P<0.01 compared to the day 1). Mitochondria of week 8 and week 12 flies more frequently contained smaller mtNucleoids.

