Fig. 5.
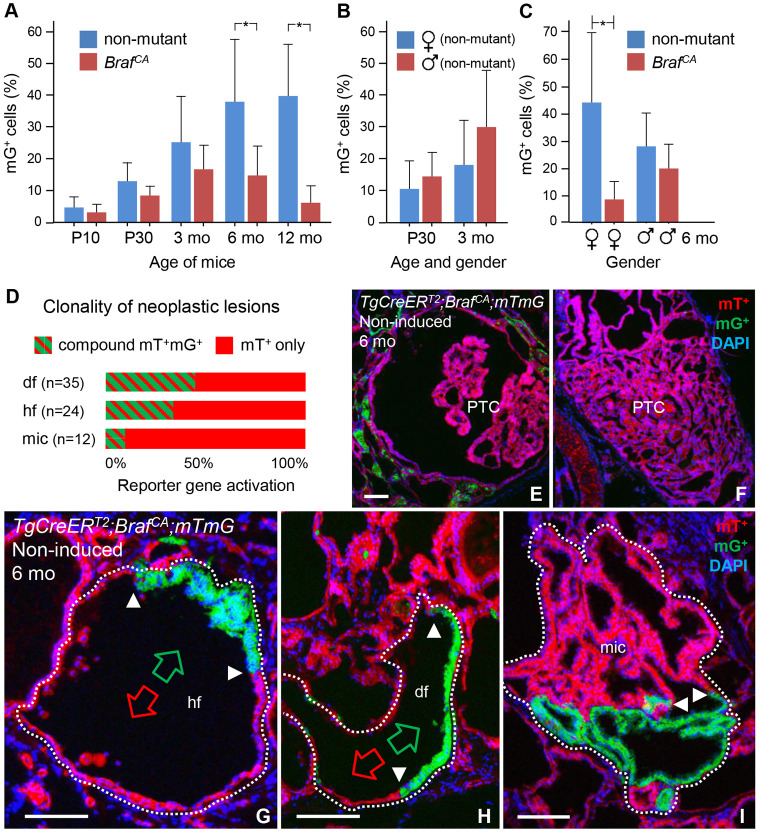
Clonal selection of growth during thyroid tumorigenesis inTgCreERT2;BrafCA/+;mTmGmutant mice. All data were obtained from animals not treated with tamoxifen. (A–C) Age- and gender-dependent changes in clonal expansion of mTomato-positive (mT+) and mGFP-positive (mG+) BRAF-mutant (BrafCA) cells. Clonal growth was estimated by counting mG+ cells in serial sections of the thyroid (three levels per lobe) – at postnatal days 10 and 30 (P10 and P30, respectively) and 3, 6 and 12 months (mo) of age – in mutant mice. The percentage of mG+ cells relate to the total number of DAPI-stained epithelial cells; thus, in every measurement, 100% comprises all encountered mG- and mT-labeled follicular and tumor cells. For each time point, the accumulation of mG+ thyroid cells is compared to that of age-matched TgCreERT2;mTmG (non-mutant) mice. The spontaneous rate of reporter gene activation (blue) and clonal expansion of mT+ versus mG+ mutant cells (red) are plotted in A; mean±s.d. (*P<0.005; n=6 for each group). Equal rates of reporter gene activation in non-mutant male (red) and female (blue) thyroids are plotted in B. Gender bias of mT+ versus mG+ clonal expansion in mutant mice (red) in comparison to the accumulation of mG+ cells in non-mutant mice (blue) is plotted in C; mean±s.d. (*P<0.005; n=3 for each group in B and C). (D) Predominance of lack of versus dual clonal reporter gene activation – revealed by uniform mT+ and compound mT+mG+ labeling, respectively – in neoplastic lesions in mutant mice aged 3 months. Horizontal bars indicate the mean relative values for each labeling and the type of lesion (n, indicated in graph) in total, based on five serially sectioned thyroids. Notice that lesions composed of only mG+ cells were not observed. (E,F) Papillary carcinomas with different tumor phenotypes – i.e. classic (E) and solid variant (F) – and without any signs of reporter gene activation in the tumor cells in 6-month-old mutant mice. (G-I) Representative images of dual-labeled lesions (encircled) with distinct (G,H) or indistinct (I) growth pattern of mT+ and mG+ clones. Arrowheads indicate clone borders; green and red arrows indicate contiguous mG+ and mT+ epithelial domains, respectively. hf, hyperplastic follicle; df, dilated follicle; mic, microcarcinoma; PTC, papillary thyroid carcinoma. Scale bars: 100 µm.

