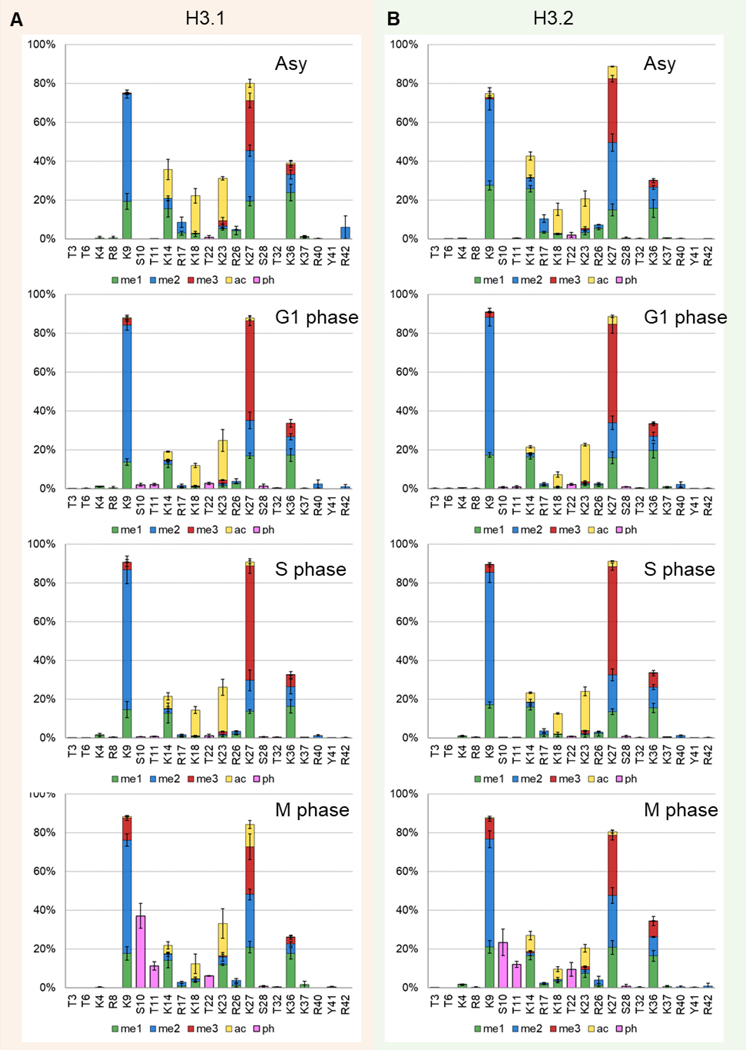
Figure 4.
Comparison of the distribution of PTMs per amino acid residue of (A) H3.1 and (B) H3.2 between the cell cycle phases. Average ± standard deviation of three replicates. Color code represents different PTMs: mono-methylation (me, green), di-methylation (me2, blue), tri-methylation (me3, red), acetylation (ac, yellow), and phosphorylation (ph, pink).

