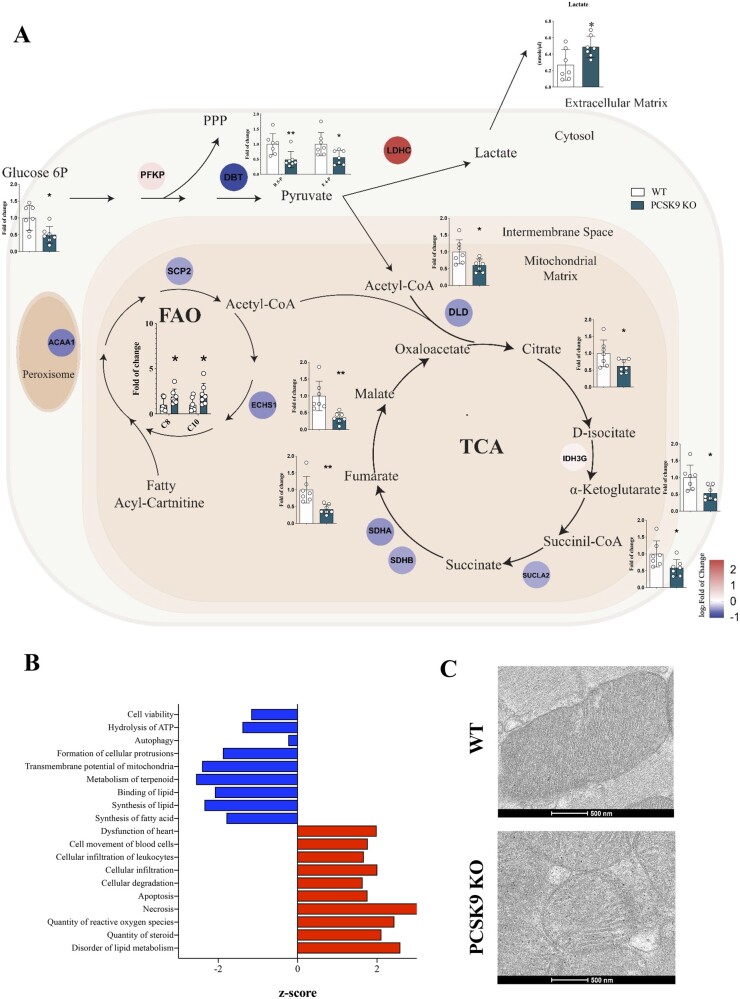
Figure 3.
Metabolic profile of failing Pcsk9 KO heart. (A) Results from combined metabolomic, proteomic and lipidomic profile in the heart of Pcsk9 KO mice compared to wild-type mice are shown. Metabolites that are significantly modulated (belonging to glycolysis, pentose phosphate pathway, Krebs cycle, or carnitines for beta-oxidation) (G6-P, P = 0.012; R5-P, P = 0.01; E4-P, P = 0.02; acetyl-CoA, P = 0.02; citrate, P = 0.04; α-ketoglutarate, P = 0.01; succinyl-CoA, P = 0.03; fumarate, P = 0.003; malate, P = 0.003; C8, P = 0.048; C10, P = 0.048) are shown in bar graph as fold of change ± SD; n = 7 mice per group. Proteins that were significantly modulated following proteomics analysis are shown as coloured dots. Plasma levels of lactate are shown (P = 0.02). Data are shown as mean ± SD; n = 7 per group. (B) Functional pathway analysis of proteomics data is presented. Hierarchical clustering is based on Pearson’s correlation and heatmap showing relative protein expression values (z-score-transformed LFQ protein intensities) of n=65 proteins corresponding to ETC mitochondrial complexes in GO analysis (FDR < 0.05). Non-parametric t-test was used to compare each group. (C) Representative photomicrographs of myocardium mitochondria by transmission electron microscopy are shown. (*P < 0.05 and **<0.01)

