
FIGURE 2.
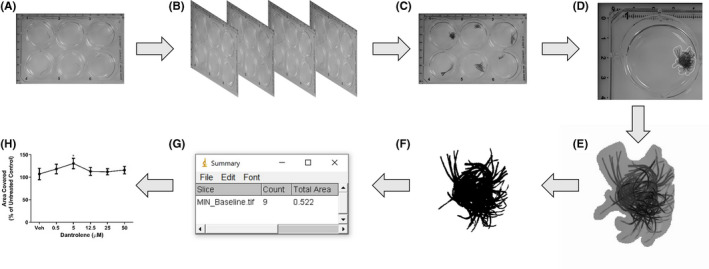
Measuring free locomotion of Lumbriculus variegatus. (A) L. variegatus are plated in 6‐well plates 18–24 h before the experiment begins. (B) 50 images are then collected at 1‐s intervals. (C) Images are then arranged into a z‐stack and scale is set to an area of known distance within the z‐stack. (D) Each individual L. variegatus is isolated using freehand selection and (E) isolated from the remaining image. (F) Thresholds are then set to only select L. variegatus and background is then removed. (G) The total area covered by each L. variegatus can then be calculated using the set scale and (H) graphed for presentation and analysis. (A–F) is repeated for each L. variegatus to give the baseline movement before exposure to drug compounds, 10 min after incubation with drugs and 10 min and 24 h in artificial pondwater only. Data are expressed as a percentage of baseline controls