
FIGURE 2.
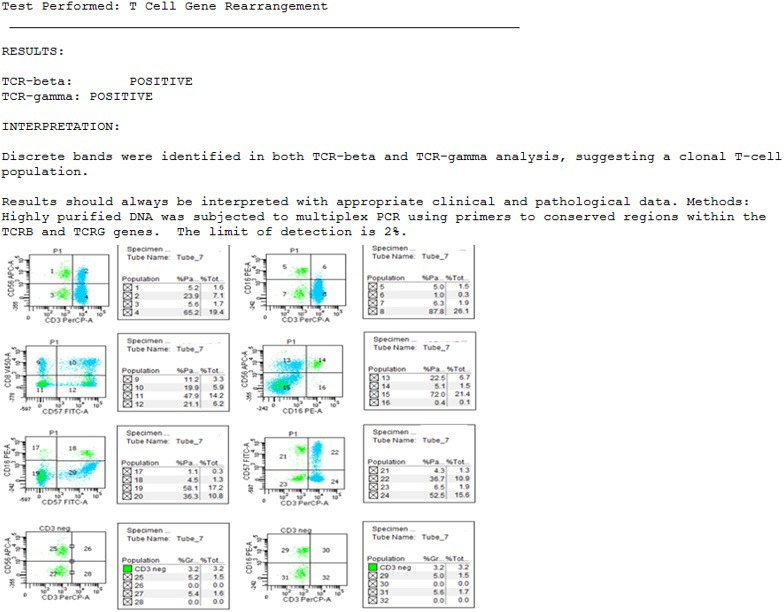
TCR gene rearrangement shows positive TCRβ and TCRγ. C. Peripheral blood flow cytometry histogram depicting an increase in NK‐like T cells CD57+/CD3+ comprising 10.3% of the total population with different subtypes like CD57+/CD8+ comprising 5.9% of the total population