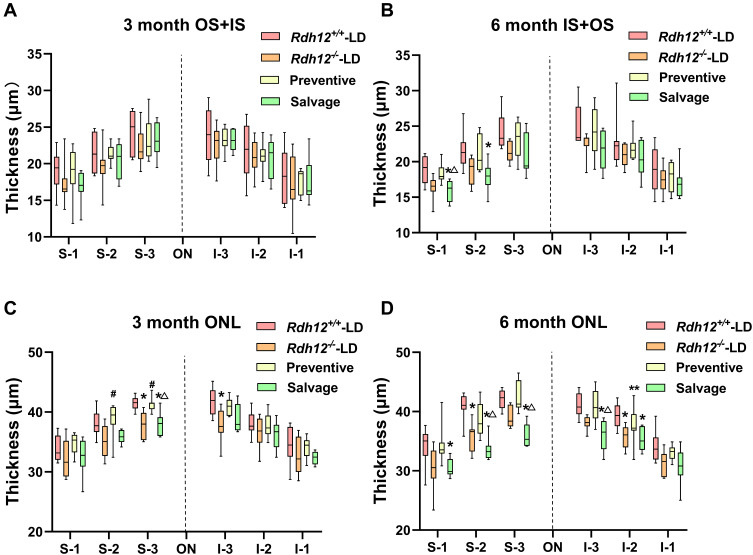
Figure 5.
Quantitative analysis of histological differences after gene therapy in four groups. The thicknesses of the combined IS and OS, ONL were measured every 400 µm across both the superior (S1-3) and inferior hemispheres (I1-3).(A) (3 months)/ (B) (6 months): quantification of the thickness of OS+IS of the retina from four groups. (C) (3 months)/ (D) (6 months): quantification of the thickness of ONL of the retina from four groups. Results were presented as median (min - max). n=8–12 per group. *P <0.05; **P <0.01 vs Rdh12+/+-LD group. #P < 0.05 vs Rdh12−/−-LD group. ΔP < 0.05 vs preventive group.

