Figure 2.

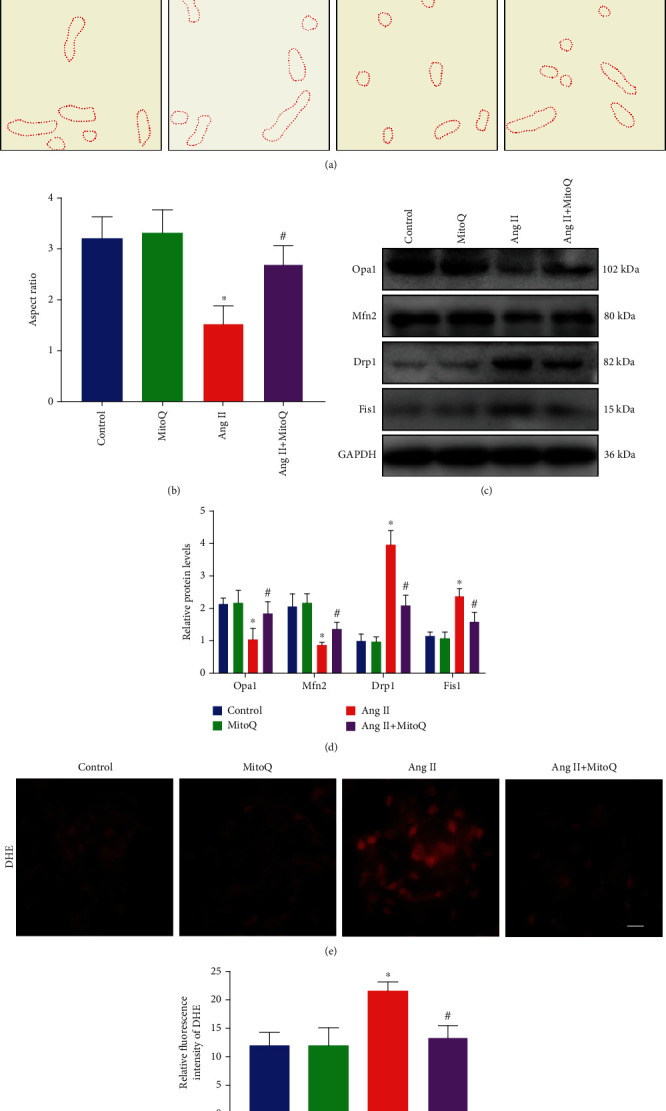
MitoQ ameliorates mitochondrial fission and ROS production in Ang II-infused mice. (a) Representative image of mitochondrial ultrastructure in podocytes from each group by TEM (original magnification, ×10000), scale bar = 1 μm. (b) Quantitative analysis of the mitochondrial aspect ratio in the different groups. (c) Western blot analysis of Opa1, Mfn2, Drp1, and Fis1 in glomeruli from different groups. (d) Quantification of protein levels from (c). (e) DHE staining to detect oxidative stress in glomeruli from different groups (original magnification, ×600), scale bar = 20 μm. (f) Quantification of fluorescence intensity from (e). ∗P < 0.05 vs. the normal saline infusion group; #P < 0.05 vs. the Ang II infusion group. n = 5.
