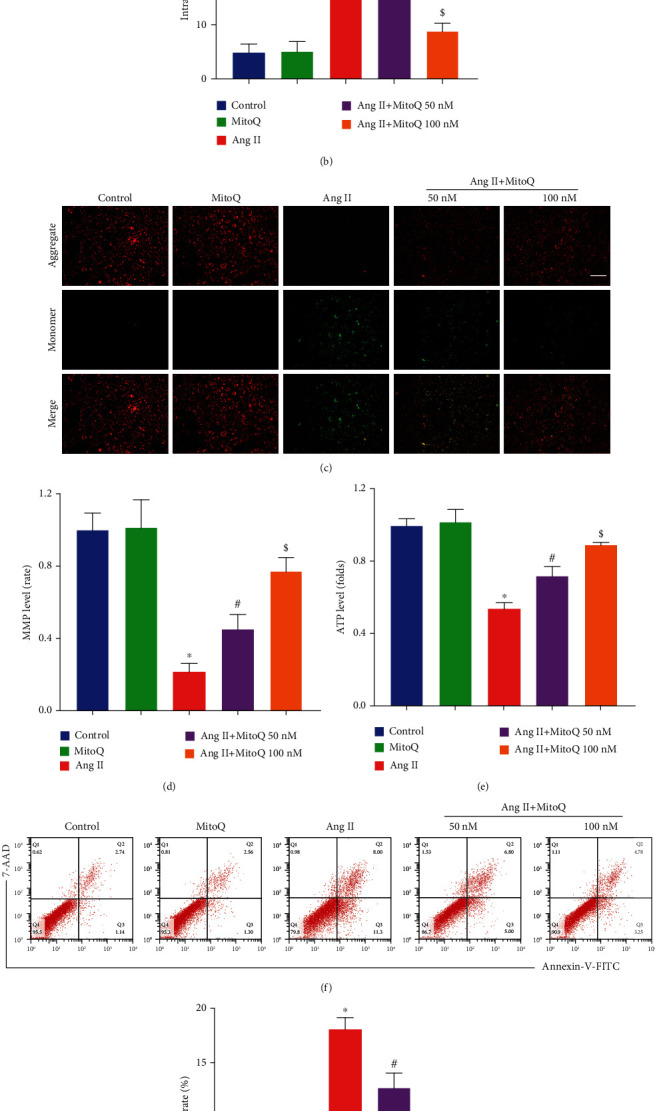
Figure 4.

MitoQ attenuates oxidative stress, mitochondrial dysfunction, and apoptosis in vitro. (a) Representative DCFDA staining image of podocytes from each group (original magnification, ×100), scale bar = 100 μm, n = 7. (b) Quantitative analysis of ROS content from (a). (c) JC-1 staining to assess membrane potential (original magnification, ×200), scale bar = 200 μm, n = 4. (d) Quantitative analysis of membrane potential from (c). (e) Relative ATP content from each group, n = 3. (f) Podocyte apoptosis assessed by flow cytometry in different groups, n = 3. (g) The apoptosis rates in different groups from (f). ∗P < 0.05 vs. control; #P < 0.05 vs. Ang II; $P < 0.05 vs. Ang II+MitoQ 50 nM.
