
Figure 5.
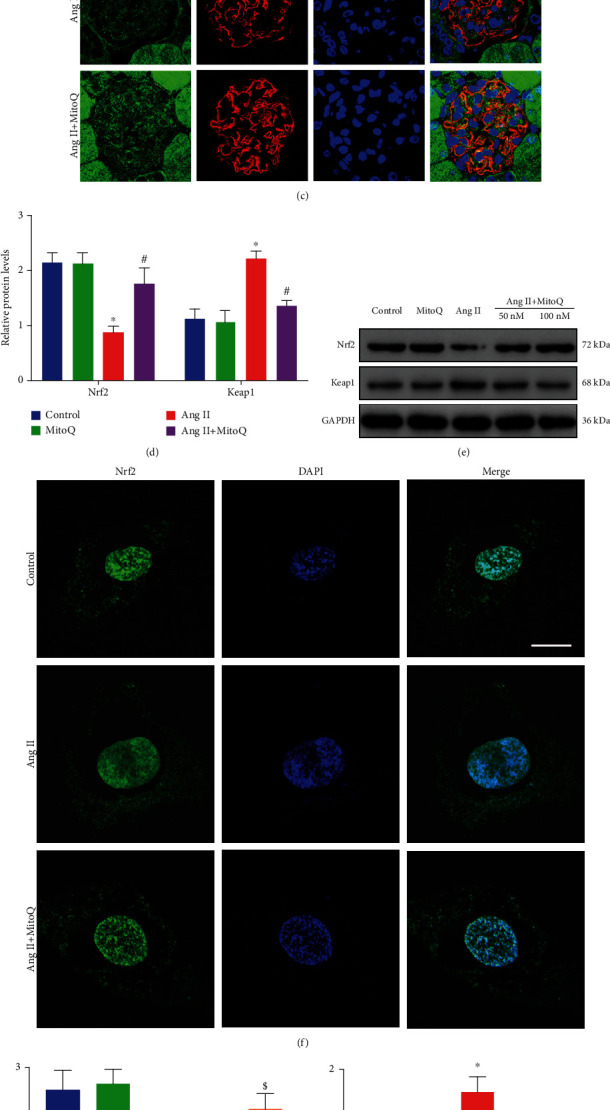
Effects of MitoQ on the expression of Keap1 and Nrf2 in podocytes in vivo and in vitro. (a) Western blot analysis of Keap1 and Nrf2 in glomeruli from different groups, n = 3. (b) Representative immunohistochemistry staining of Nrf2 in glomeruli from different groups (original magnification, ×600), scale bar = 20 μm. (c) Representative fluorescence staining of Nrf2 (green), synaptopodin (podocytes, red), and DAPI (blue) in podocytes from different groups (original magnification, ×1000), scale bar = 10 μm, n = 5. (d) Quantitative analysis of protein levels from (a). (e) Western blot analysis of Keap1 and Nrf2 in podocytes in vitro, n = 3. (f) Representative fluorescence staining of Nrf2 in podocytes in vitro (original magnification, ×1000), scale bar = 15 μm, n = 5. (g, h) Quantitative analysis of protein levels from (e). (i) Quantitative analysis of the nuclear translocation of Nrf2. ∗P < 0.05 vs. control; #P < 0.05 vs. Ang II; $P < 0.05 vs. Ang II+MitoQ 50 nM.