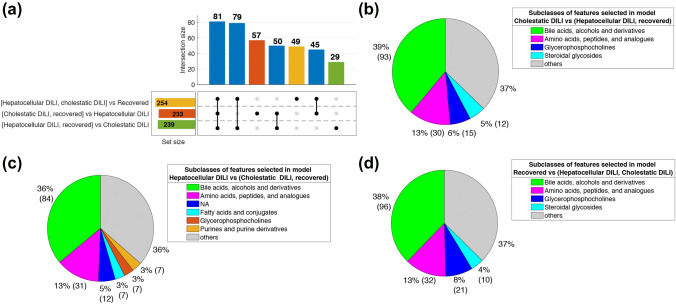
Fig. 4.
UpSet plot depicting the number and intersections of the features with VIP > 1 in the hepatocellular DILI vs. the group of cholestatic DILI and recovered patients, cholestatic DILI vs. the group of hepatocellular DILI and recovered patients, and recovered vs. the group of hepatocellular and cholestatic DILI patients PLS–DA models. Pie plots show the distributions of the main subclasses of the features selected as discriminant in the three models. Note: NA: features with no subclass included in the HMDB

