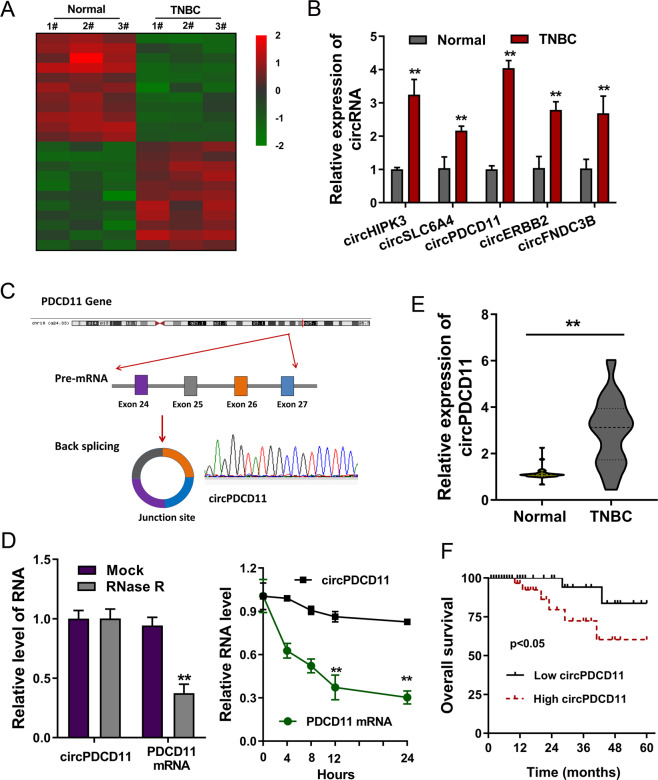
Fig. 1. A circRNA microarray revealed the high expression of circPDCD11 in TNBC.
A Heatmap of microarray analysis showing the up- and downregulated circRNAs in three pairs of cancer tissue and normal tissue. B RT-PCR demonstrated several upregulated circRNAs in TNBC specimens, including circPDCD11. C Schematic diagram showing that circPDCD11 was derived from PDCD11 pre-mRNA and generated through exon 27 ~ exon 24 back splicing (hsa_circ_0019853, 461 bp). D RT-PCR demonstrated circPDCD11 and linear transcript (PDCD11 mRNA) expression after treatment with RNase and actinomycin D. E RT-PCR demonstrated circPDCD11 expression in TNBC clinical specimens (32 samples) compared with adjacent normal specimens (32 samples). F Kaplan–Meier survival analysis illustrated the correlations between circPDCD11 expression (high = 16, low = 16) and overall survival of the TNBC patients from the enrolled samples. A p value was calculated using a log-rank test. Data are expressed as the mean ± SD. **p < 0.01.

