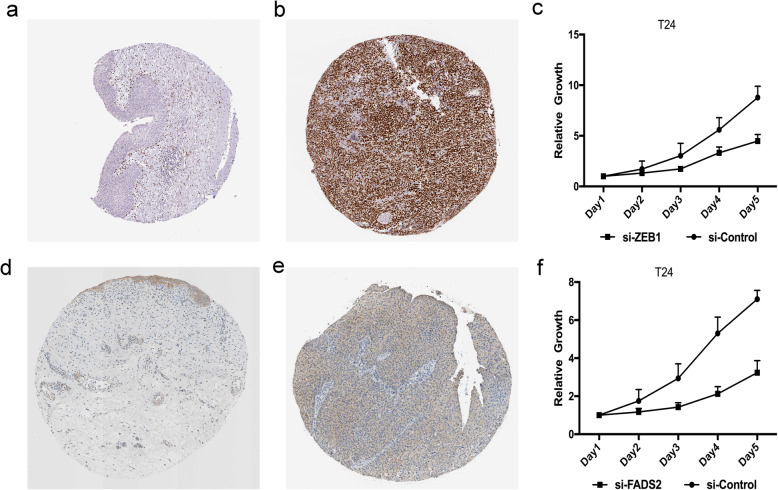
Fig. 7.
Experimental verification of ZEB1 and FADS2. Immunohistochemical images from the HPA database show ZEB1 protein expression in normal bladder (a) and BLCA (b) tissues. (c) CCK-8 assay results show the relative proliferation of si-control- and si-ZEB1-transfected T24 cells. The data is presented as means ± SD. Immunohistochemical images from the HPA database show FADS2 protein expression in normal bladder (d) and BLCA (e) tissues. (f) CCK-8 assay results show the relative proliferation of si-control- and si-FADS2-transfected T24 cells

