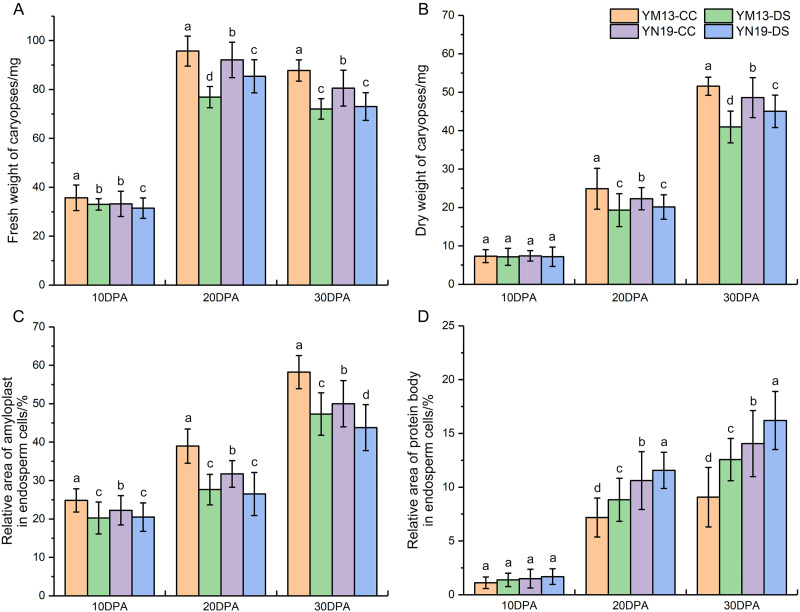
Figure 2. Changes in caryopsis weight and endosperm enrichment in wheat under drought stress.
(A) Fresh weight of caryopses. (B) Dry weight of caryopses. (C) Ratio of amyloplast area to endosperm area. (D) Ratio of protein body area to endosperm area. CC, control condition; DS, drought stress. Different lowercase above the histogram indicate significant difference (p < 0.05).

