
Extended Data Fig. 2 |. Bland-Altman plots comparing cardiac measurements from labeled vs. predicted structures.
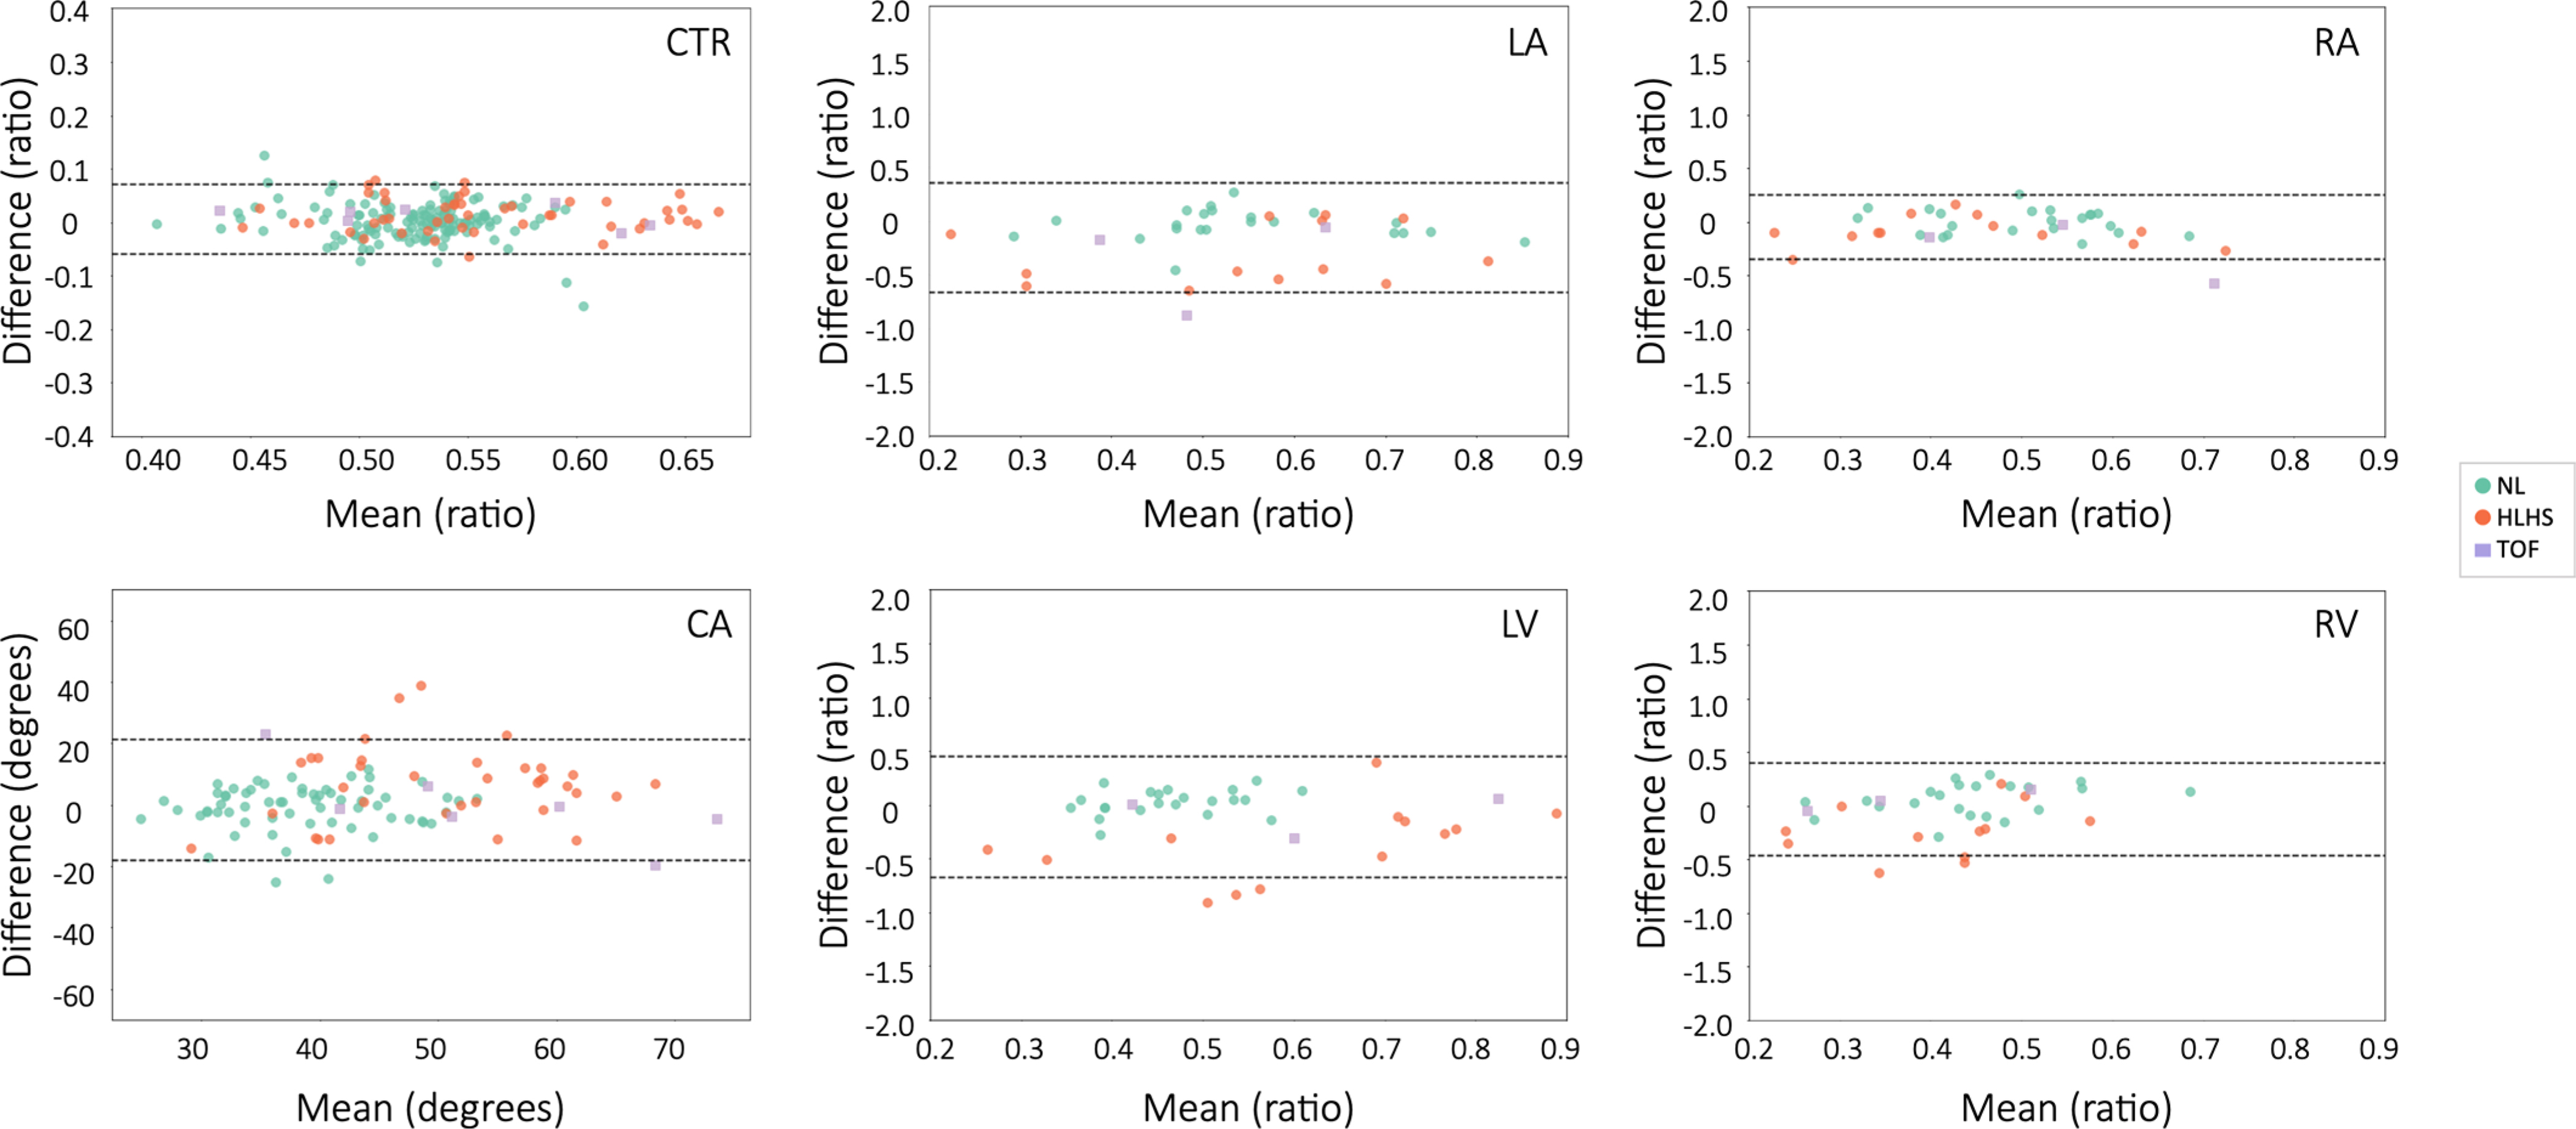
CTR, cardiothoracic ratio; CA, cardiac axis; LV, left ventricle; RV, right ventricle; LA, left atrium, RA, right atrium. Legend indicates measures for normal hearts (NL), hypoplastic left heart syndrome (HLHS), and tetralogy of Fallot (TOF).