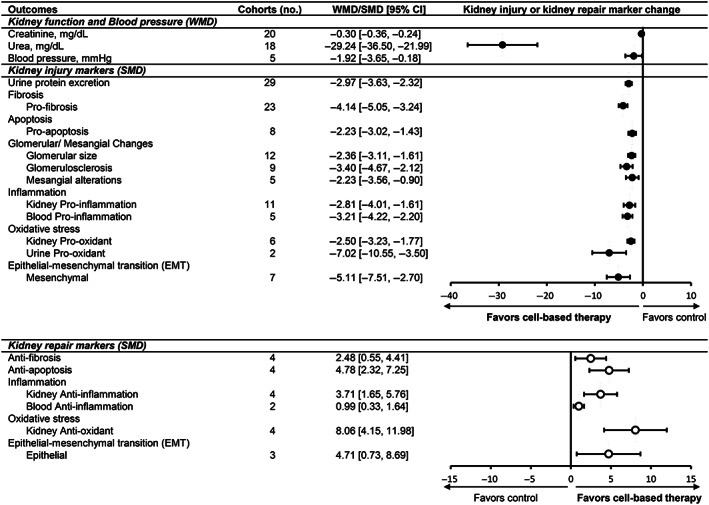
FIGURE 2.

Effect of cell‐based therapies on kidney outcomes in animal models of DKD. Forest plots display changes in kidney function, blood pressure, kidney injury markers, and kidney repair markers following cell‐based therapy in diabetic animals. Data are displayed as weighted mean difference (WMD) or standardized mean difference (SMD) and 95% confidence intervals (CIs). Weights are from random effects analysis. Creatinine and urea are measured in plasma. Blood pressure represents systolic and diastolic readings. Forest plot: closed circles represent kidney injury markers; open circles represent kidney repair markers. DKD, diabetic kidney disease; EMT, epithelial‐mesenchymal transition
